Whether the stock market is trending higher or lower, or even trading sideways, I’ve always found it helpful to watch the equal weight indices for insights about market breadth and market health.
So today, with the S&P 500 Index trading at new highs, I think it’s a good idea to check in on the S&P 500 Equal Weight Index.
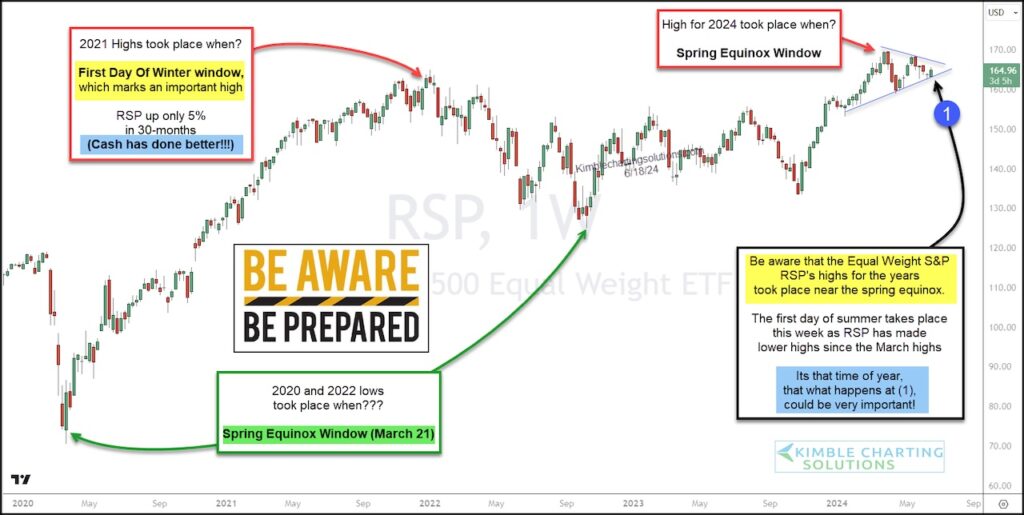
We’ll do this via the “weekly” chart of the S&P 500 Equal Weight ETF (RSP).
Here we can see that RSP has peaked and bottomed at the start of Spring or Winter on a few occasions. And fast forwarding to Spring 2024, we can see another potential inflection point in the form of a narrowing “triangle” top at (1).
But there’s another important layer of analysis to this. In my 44-years in the business, I still find it ironic to say RSP is in a bull market when it’s barely up 5% over the past 30-months. This isn’t performing anywhere close to the S&P 500 Index. Even cash has outperformed it by a good bit!
So what’s it going to be? A breakdown and more underperformance (bearish)? Or a breakout and some catchup to the unweighted index (bullish)?
In my humble opinion, what happens at (1) could be the key to understanding the next move in the markets. Stay tuned!
S&P 500 Equal Weight ETF “weekly” Chart
Note that KimbleCharting is offering a 2 week Free trial to See It Market readers. Just send me an email to services@kimblechartingsolutions.com for details to get set up.
Twitter: @KimbleCharting
The author may have a position in mentioned securities. Any opinions expressed herein are solely those of the author, and do not in any way represent the views or opinions of any other person or entity.


 Having Its Day: What’s Next?")
