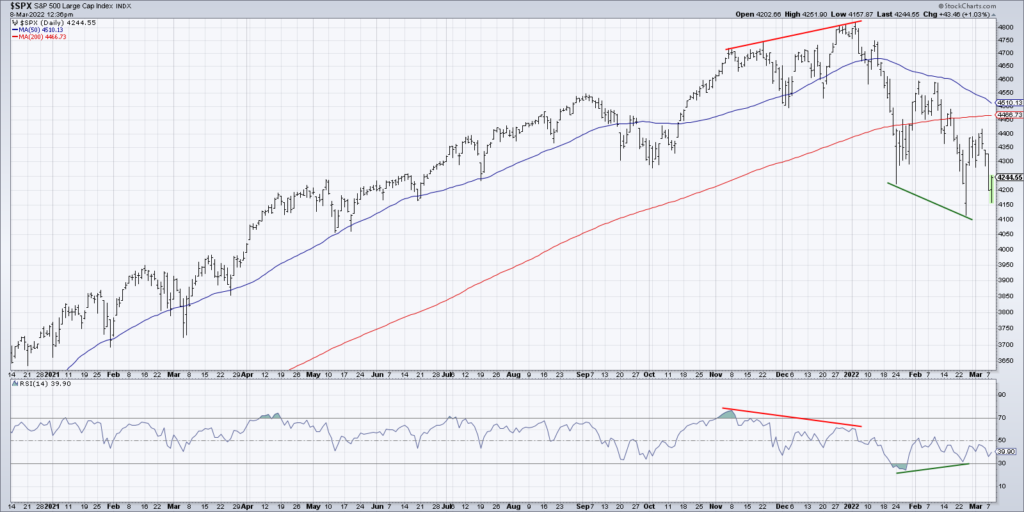
The US equity markets essentially topped out in November of last year. While the S&P 500 index actually made a higher high in January 2022, the Nasdaq 100 along with many popular breadth indicators actually peaked out in November.
As the major stock market indexes have moved significantly lower over the last two months, it’s worth noting that the momentum characteristics for the S&P 500 have noticeably declined. The RSI for the S&P 500 peaked in early November, and the new high in January actually saw a lower RSI value.
This created what is called a bearish momentum divergence, where price moves higher but momentum indicators like RSI actually make a lower high.
In recent weeks, we’ve seen the RSI make a new intraday low around 4120. That comes after the January low came in around 4220. Now we have seen a bullish momentum divergence, where the RSI was oversold on that January low but did not become oversold on the February low.
Does that mean the S&P 500 rallies from here?
Not necessarily.
In today’s video, we’ll review some best practices related to RSI and bullish momentum divergences, break down how 2022 has evolved from a momentum perspective, and answer three key questions about this S&P 500 bullish divergence and divergences in general.
- What happens when the divergence does not follow through, meaning the price just continues to push lower?
- Are bullish divergences too much of a lagging indicator to actually be profitable?
- Do divergences work only for RSI, or can you find similar patterns with other technical indicators like MACD?
Ready to upgrade your investment process? Check out my free course on behavioral investing!
(VIDEO) S&P 500 Bullish Divergence – What to make of it?
S&P 500 Chart

Twitter: @DKellerCMT
The author may have positions in mentioned securities at the time of publication. Any opinions expressed herein are solely those of the author, and do not in any way represent the views or opinions of any other person or entity.


