I have never been much for tracking EPS and Revenues as the defining decision for whether or not to own a stock.
Sometimes consumer instinct, even if that is in contrast to earnings, is the better judgement to use. Today, we tie this concept in to look at electric car maker Rivian.
For example, Amazon took years to turn a profit, even though it was obvious to us that more and more people were using it to purchase EVERYTHING for the most part.
Lately, I see more and more Rivians driving on the roads in our town.
Is this as seductive as Amazon?
No.
But does that mean at $16 a share compared to Tesla’s $220 a share price, Rivian is sexy?
Yes.
Some stats from Rivian’s production and earnings:
Rivian Automotive, Inc. (NASDAQ:RIVN).
On July 2nd, Rivian announced production and delivery totals for the quarter ending June 30, 2024.
The company produced 9,612 vehicles at its manufacturing facility in Normal, Illinois and delivered 13,790 vehicles during the same period.
Production and delivery results during the second quarter of 2024 were in line with Rivian’s expectations.
For the full year 2024, management is reaffirming guidance for annual production of 57,000 total vehicles.
The company also announced that on August 6th, after market close, it will release its second quarter 2024 financial results.
For Rivian Automotive, the Most Accurate Estimate is lower than the Zacks Consensus Estimate, suggesting that analysts have recently become bearish on the company’s earnings prospects.
This has resulted in an Earnings ESP of -10.68%.
On the other hand, the stock currently carries a Zacks Rank of #2.
So, this combination makes it difficult to conclusively predict that Rivian Automotive will beat the consensus EPS estimate.
Nonetheless, Zacks report has Rivian ranked as a number 2 buy.
They see this stock at 100 by 2026.
I am not sure I can wait until August 7th to buy Rivian’s stock.
However, for now, I am looking at the charts before making any firm commitment.
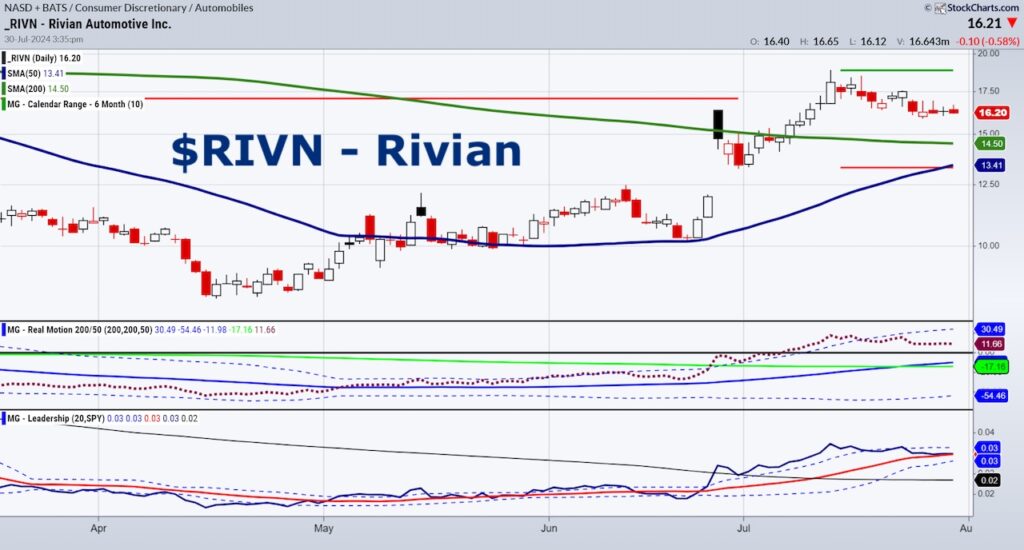
On the daily chart, the 200-day moving average is above the 50-day moving average putting RIVN in an accumulation phase.
The July 6-month calendar range high has turned out to be good resistance.
The 50-day moving average is perfectly aligned with the July 6-month calendar range low to give investors a meaningful risk parameter.
Real Motion had a mean reversion sell, but-
The moving averages are stacked bullish!
The Leadership indicator has Rivian neck in neck with the benchmark.
We would love to see Rivian trade closer to 13.50.
However, if that does not happen, there could be a clean breakout coming and August 6th is only a week away.
Twitter: @marketminute
The author may have a position in mentioned securities at the time of publication. Any opinions expressed herein are solely those of the author and do not represent the views or opinions of any other person or entity.


