One global stock market index that investors should be watching right now is the Japanese Nikkei 225.
Why? Because 35 years after it made a high in 1989 (and turned lower in one of the worst bear markets in history), it is finally trading back at that 1989 price level.
But there’s more…
“The facts, Ma’am. Just the facts.” – Joe Friday
A trip down memory lane: I remember my old boss Sir John Templeton selling Japan shares in 1988 that he had bought in the 1960’s. He was a heck of an investor. What a trade!
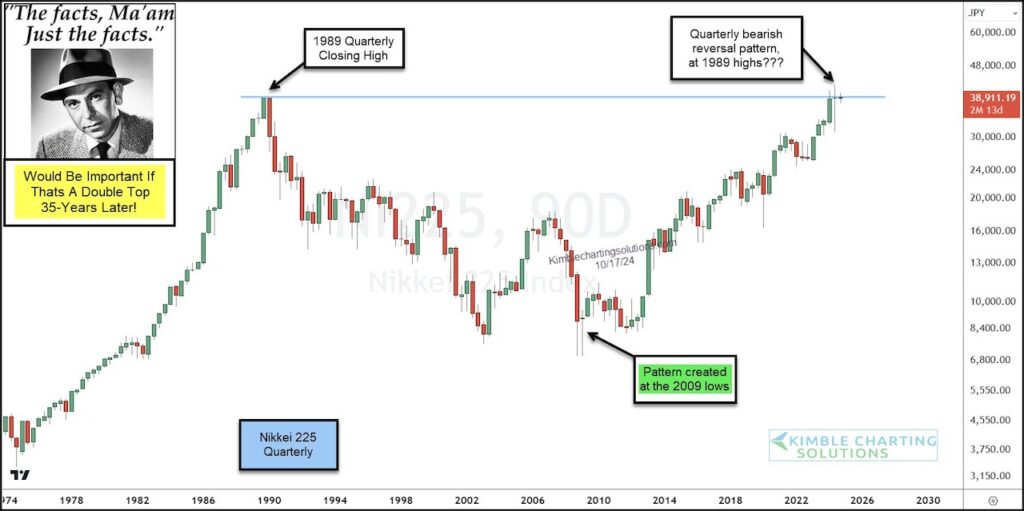
This only adds to the importance of the 1989 high and this area of resistance that the Nikkei 225 faces right now.
As you can see, the chart below is a long-term “quarterly” chart. And in the process of testing this critical resistance, the Nikkei 225 created a bearish reversal pattern last quarter.
What happens this quarter will be important for both Japanese and global equity investors. Put this on your radar. And stay tuned!
Nikkei 225 Index “quarterly” Chart
Twitter: @KimbleCharting
The author may have a position in mentioned securities. Any opinions expressed herein are solely those of the author, and do not in any way represent the views or opinions of any other person or entity.
: Creating Bullish Divergence?")


 and Semiconductors (SMH): Concerning Price Pattern?")


