I love tech stocks. And you should too.
But perhaps not at current levels. I bet you’ve heard that one before… like for the past several weeks.
This is why patience is important. And having a plan. And looking for select stocks. For those that are trend traders with a plan (targets and stops) – stay disciplined.
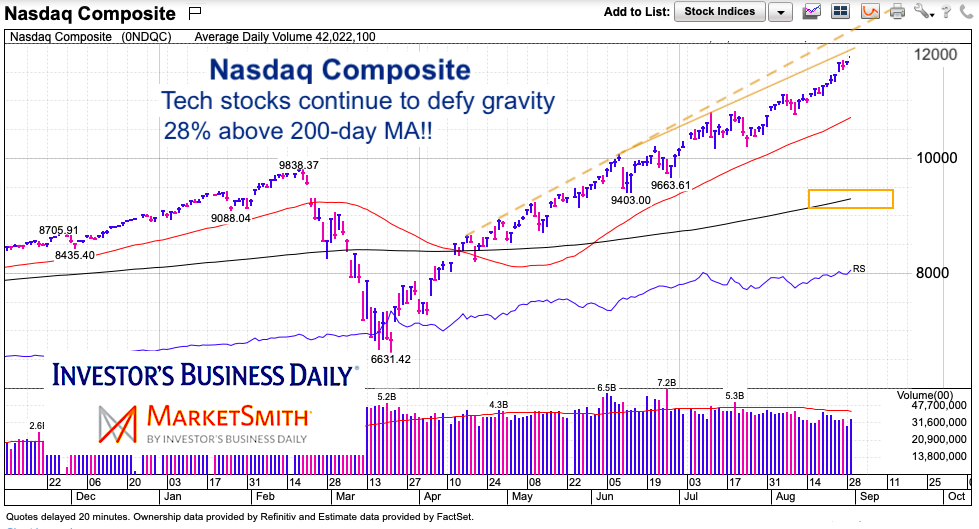
Today’s chart is not of an individual stock, but of the broad Nasdaq Composite. I share just 2 simple indicators (amongst many) to highlight why it may be time to up your mental discipline with those select tech stocks investors like.
Note that the following MarketSmith charts are built with Investors Business Daily’s product suite.
I am an Investors Business Daily (IBD) partner and promote the use of their products. The entire platform offers a good mix of technical and fundamental data and education.
Nasdaq Chart
As you can see on the chart, the upper trend line (higher highs), is being met on an intermediate-term basis. Also, the longer-term upper trend line (dotted), is about 5-7% higher. Could that be met? Sure. Is it likely? Probably not. This is where you decide how greedy you want to be. Perhaps tightening stops and using trim and trail (taking profits on extended names.
As well, the Nasdaq is trading 28% above its 200-day moving average. That underscores the strong trend… but also the need for healthy consolidation or pullback. September could cool things off.

Twitter: @andrewnyquist
The author may have a position in mentioned securities at the time of publication. Any opinions expressed herein are solely those of the author, and do not in any way represent the views or opinions of any other person or entity.


