It’s been a tough environment for the Utilities Sector.
The ETF (XLU) has underperformed for months and really stunk it up in recent weeks.
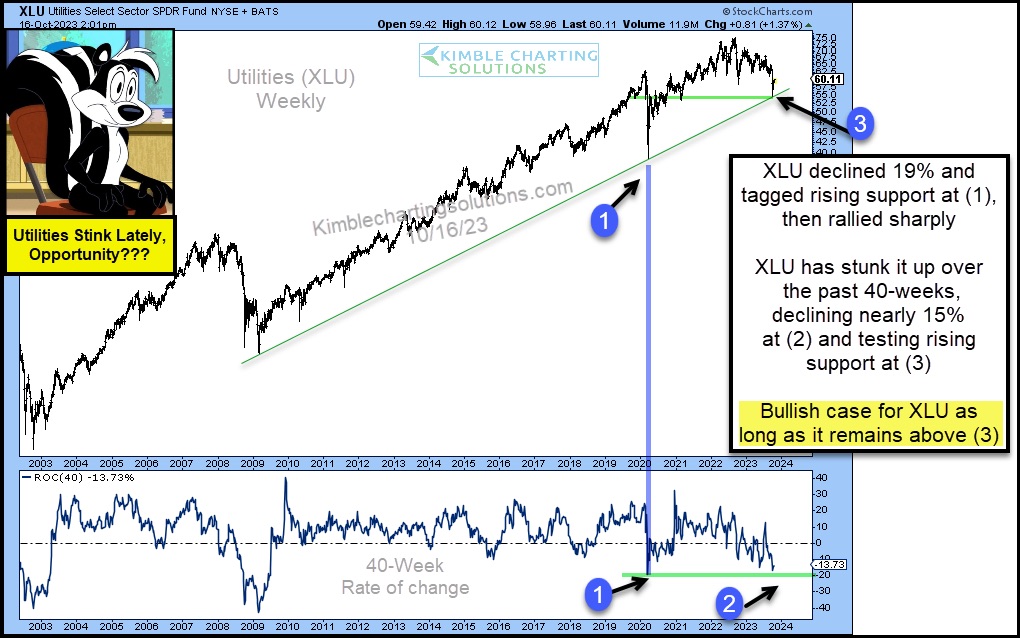
Looking at the chart below, you can see that XLU declined 19% in 2020, tagging its uptrend line at (1) before rallying sharply. Fast forward to today and we can see that XLU decline nearly 15% at (2) while testing its rising trend line and lateral support at (3).
The decline looks to be a bullish set up as long as XLU stays above support at (3).
Are stinky Utilities ready to reverse higher? Stay tuned!
$XLU Utilities Sector ETF “weekly” Chart

Note that KimbleCharting is offering a 2 week Free trial to See It Market readers. Just send me an email to services@kimblechartingsolutions.com for details to get set up.
Twitter: @KimbleCharting
Any opinions expressed herein are solely those of the author, and do not in any way represent the views or opinions of any other person or entity.


