One of the story lines of the 2015 trading year is far shares of GoPro (GPRO) have fallen.
The one-time Wall Street IPO darling has been hit hard as concerns mount about new products and growth pipelines. But if we take a break from all the headlines and simply focus on the charts, we can see a nice trading setup developing for GoPro stock.
I don’t use many indicators on my charts. I mostly pay attention to price action and pivots. Pivot Points are a predictive indicator. They predict where support (buyers) and resistance (sellers) lurk. Pivots are figured out using a math calculation based on the previous period High, Low & Close. Since computers run on math calculations, it is very easy for programmers to write algorithms using pivots.
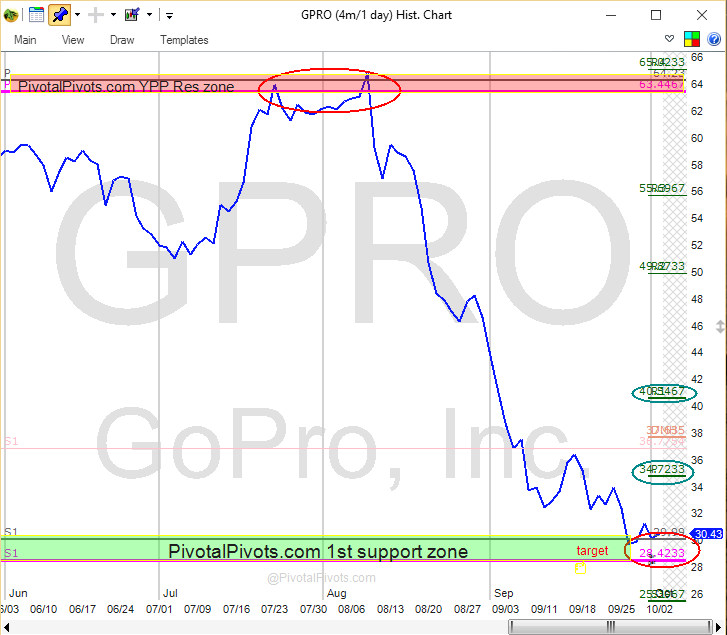
In my experience, the BIG reversal moves usually happen at (or near) the Yearly Pivots. In late July and early August GoPro stock (GPRO) ran into strong resistance (sellers) at the Yearly(P) pivot zone at $65.00. It fell hard and now has landed on the YearlyS1 pivot zone. You can see on the chart how price has moved from Pivot2Pivot. I personally think the $28-$29 level is a good area to cover shorts and try a risk-managed long (i.e. with a stop).
GoPro (GPRO) Pivot Chart
What I’m Watching
If the bullish setup plays out, GPRO should consolidate/base out here for a few weeks before moving higher. The first resistance would be at the Monthly(P) pivot at $35. If it can clear $35, then the monthlyR1 pivot would come into view at $41. In full disclosure, I took a long position in GoPro stock. My stop will be on any close below $28.
For my PivotalPivots market timing alerts, please visit PivotalPivots.com. Thanks for reading and have a great weekend.
Twitter: @mpgtrader
The author has a long position in GPRO at the time of publication. Any opinions expressed herein are solely those of the author, and do not in any way represent the views or opinions of any other person or entity.


