Apple (AAPL) reported 4th quarter results last week that disappointed investors. It’s stock fell 5 percent, while slipping below the $110 per share mark for the first time since September.
But there might be something more going on here (insert: there always is).
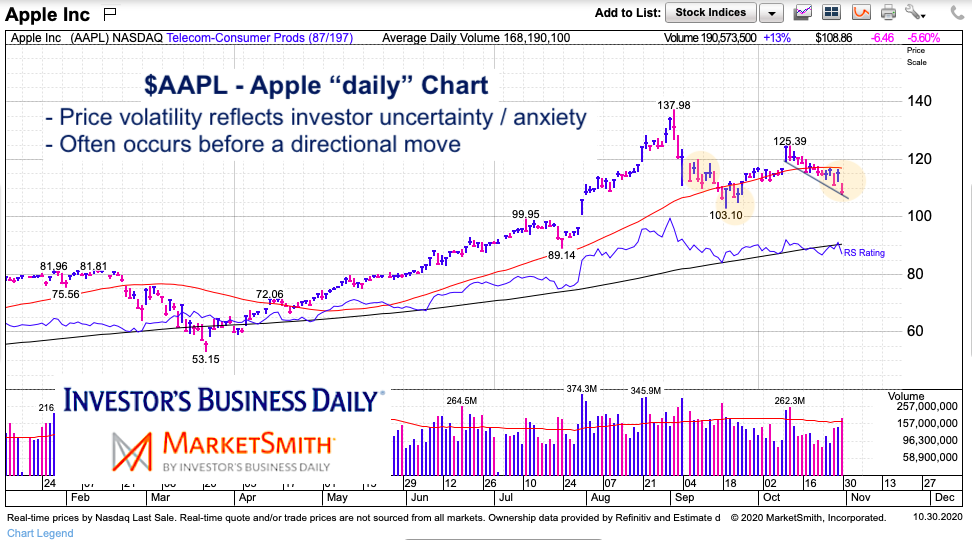
Apple’s stock price moved nearly 5 percent for 3 days in a row. Similar price movements were seen twice in September; one prior to a continuation move lower and the other just before a reversal higher.
In any event, price volatility often precedes directional moves. And considering earnings just took place, it’s wise for traders and investors to remain focused here and follow the price action.
Note that the following MarketSmith charts are built with Investors Business Daily’s product suite.
I am an Investors Business Daily (IBD) partner and promote the use of their products. The entire platform offers a good mix of technical and fundamental data and education.
Apple (AAPL) “daily” Stock Chart
Easier said than done. Looking at the daily chart, we can see that Friday’s decline is at the bottom of the short-term pullback channel.
For a bigger move lower: A break below $105 will signal a full retest fo the September low and a potential A-B-C correction down to the $90 area (and 200-day moving average).
For a reversal and big move higher: Price is trading below the 50 day moving average, so if this move is a “shake out”, then active investors will want to see price retake the 50 day moving average (quickly)… followed by a burst back above the October high.

Apple (AAPL) “weekly” Stock Chart
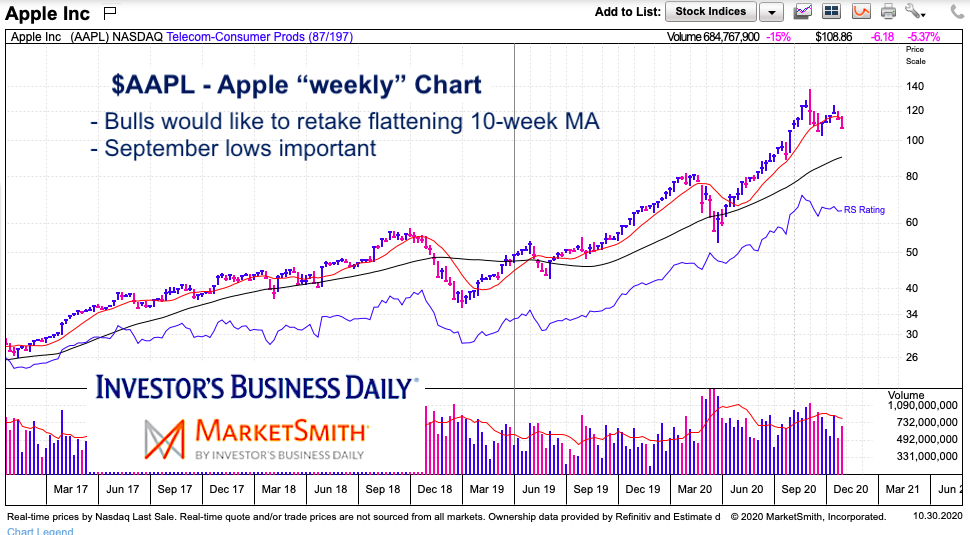
On the weekly chart, the 10-week moving average is flattening and at risk of moving lower. Bulls need to step up and retake the $120 level.

Twitter: @andrewnyquist
The author may have a position in mentioned securities at the time of publication. Any opinions expressed herein are solely those of the author, and do not in any way represent the views or opinions of any other person or entity.


