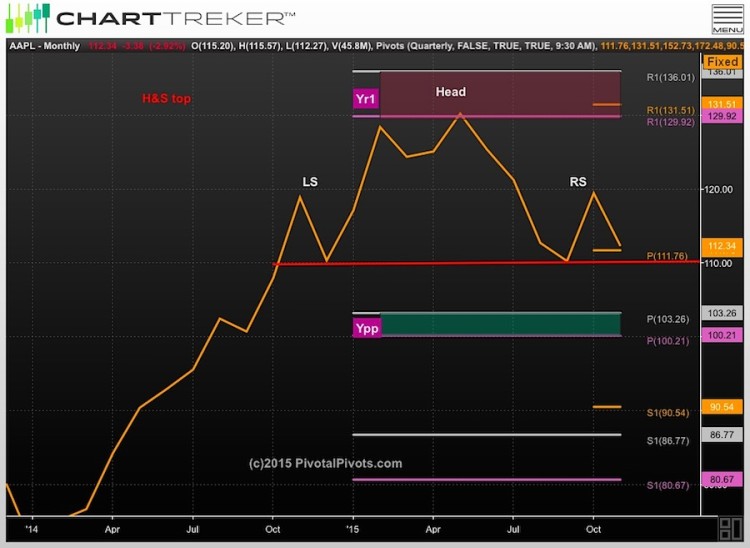
Considering all the Apple (AAPL) stock fans and investors, this probably won’t be a popular post. Looking at the Apple stock chart, I am seeing the potential for a AAPL head and shoulders topping pattern in the making.
I think this is an interesting development that, at a minimum, bears monitoring… especially if long Apple stock (AAPL).
This past winter/spring at PivotalPivots, I alerted my subscribers to sell AAPL in the $130-135 zone which is near the YearlyR1 pivot resistance. Pullbacks were buyable at that time down to the AAPL Yearly pivot(P) zone around $100. The bounce has played out nicely, but investors need to be caution if this pattern continues to take shape.
The monthly chart now shows a potential AAPL head and shoulders topping pattern in the making. It looks like a monthly close below the neckline at $110 will confirm the pattern.
On the flip side, if AAPL can take out last weeks high above $124, it would negate the head and shoulders pattern for now.
Apple Stock (AAPL) Pivot Chart
Thanks for reading and trade safe!
Twitter: @mpgtrader
The author does not have a position in any mentioned securities at the time of publication. Any opinions expressed herein are solely those of the author, and do not in any way represent the views or opinions of any other person or entity.


