To be successful, active investors have to watch (and create) indicators that the main stream media do not follow.
Trading is hard and it requires discipline and a strict set of rules.
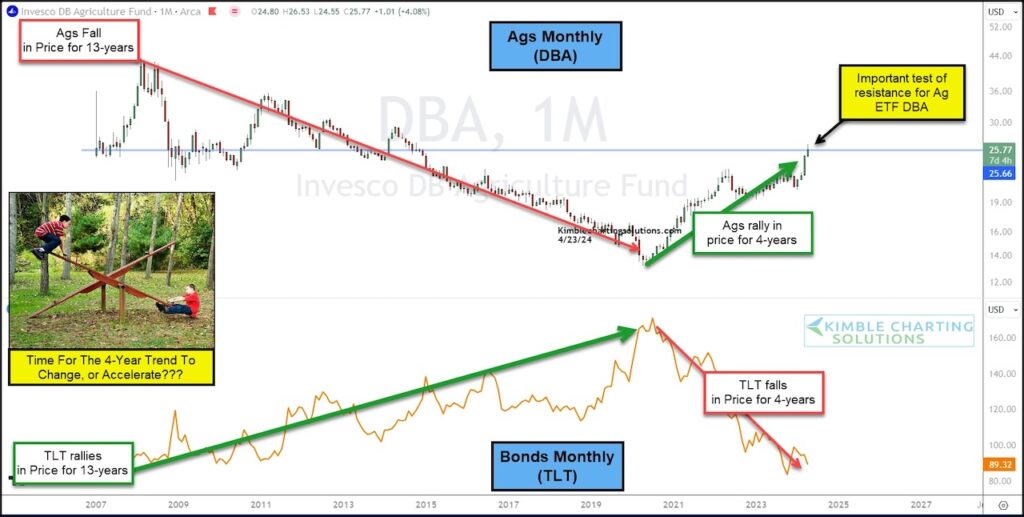
Today we look at a unique set of sectors and their binary price action: “Monthly” charts of the Invesco Agriculture ETF (DBA) versus the 20+ Year Treasury Bond ETF (TLT).
As you can see, Ag and treasuries have moved opposite of each other for nearly 17-years.
That said, the past 4 years have seen a big bounce against the trend.
Is it time for a DBA to reverse to the downside? And TLT to reverse higher? Or will DBA breakout?
In my humble opinion, it’s a big deal what happens here! Stay tuned!!
$DBA Agriculture ETF vs. $TLT Treasury Bonds ETF Performance Chart

Note that KimbleCharting is offering a 2 week Free trial to See It Market readers. Just send me an email to services@kimblechartingsolutions.com for details to get set up.
Twitter: @KimbleCharting
The author may have a position in mentioned securities. Any opinions expressed herein are solely those of the author, and do not in any way represent the views or opinions of any other person or entity.


