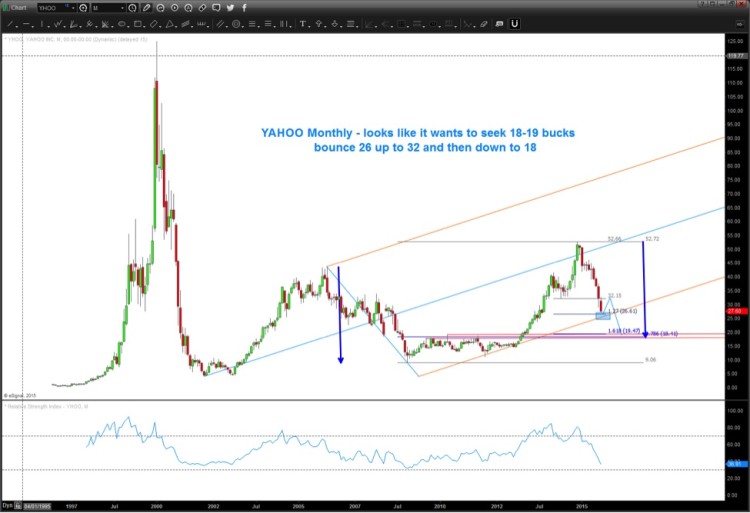
I have been posting about concerns relating to Yahoo, Inc. (YHOO) dating all the back to last year around the Alibaba (BABA) IPO. At the time, I posted about a potential topping pattern into the 50 dollar area. And since the top at $52.62, I have been navigating through the Yahoo stock decline with some downside trading patterns.
Here is a recent post from June: “Why Yahoo Stock May Head Lower Yet“.
In that post, I mentioned:
There is currently no clearly defined buy pattern that warrants attention just yet but I expect the RSI and the 34 level to offer stronger support a little lower.
Well, the mention of “no clearly defined buy pattern” proved correct. Yahoo stock bounced off $34 briefly before slicing lower through it. So, is there a bottom in sight? Based on the chart below, I see 26ish being a support zone for a bounce. It’s too early to tell, but that could lead up to $32. That’s likely not the bottom for YHOO. In my opinion, a more realistic (and stronger support level) lies around 18-19 bucks.
For now, though, keep an eye on $26/$27 level. Losing that level will likely bring a push toward the lower target.
Thanks for reading.
Twitter: @BartsCharts
Author does not have a position in mentioned securities at the time of publication. Any opinions expressed herein are solely those of the author, and do not in any way represent the views or opinions of any other person or entity.


