The financial sector and banks stocks have always carried weight in the markets. The markets tend to perform well when they are leading, and underperform up to, and during, corrections and crises.
So it’s always a good idea to monitor the health of the financial sector.
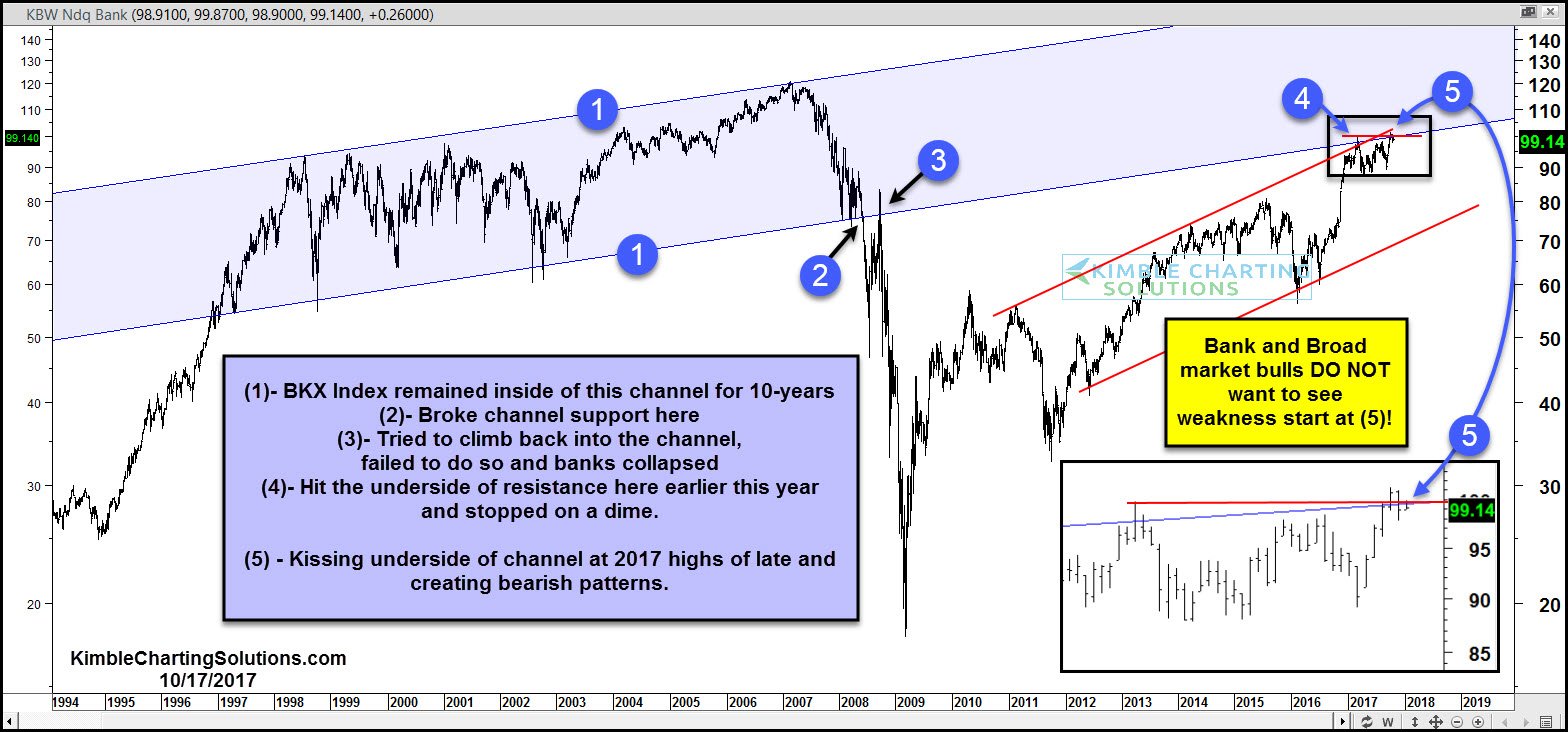
The chart below looks at the KBW Bank Index (INDEXNASDAQ:BKX) over the past 2 decades and shows why the bank stocks (and bank bulls) are at a critical juncture.
The Bank Index (BKX) has been trading near the upper end of its short-term rising trend channel (red lines). By itself, this is bullish. However, the index could be forming a double top (points 4 and 5) at the top of its short-term trend channel AND the bottom of its longer-term rising trend channel (point 1).
Bulls want to see price move back into the long-term rising trend channel. They do not want to see weakness develop here as a turn lower could strengthen resistance… as well as the prospects of a double top.
I humbly feel that what happens next for the bank Index (and banks stocks) will impact the broader market and investor portfolios. So stay tuned!
Bank Index (BKX) 20 Year Chart
Twitter: @KimbleCharting
Any opinions expressed herein are solely those of the author, and do not in any way represent the views or opinions of any other person or entity.


