Even with the emergence of the S&P 500 and Nasdaq Composite, the Dow Jones Industrial Average is still viewed prominently in international investing circles. So it shouldn’t be a surprise that the highs reached in May are a key Dow Jones resistance level (and likely watched by many). But those highs may be even more important than just any old market highs.
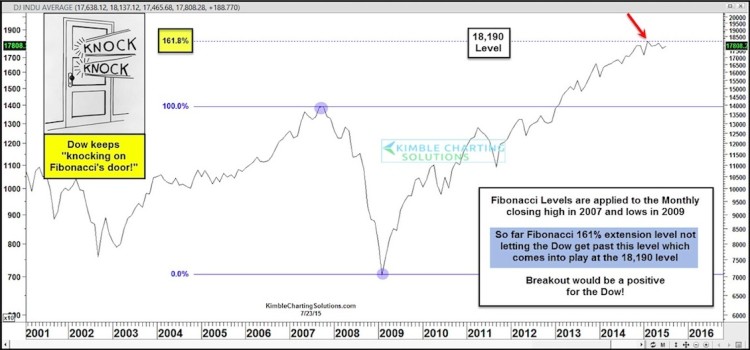
Let’s review: Looking back over the past 15 years, the 2007 highs and 2009 lows rank highly as important pivotal points in the market. And it seems that those two dates may have an impact on the Dow Jones in 2015. More precisely, when using those extreme highs and lows, we can calculate a Fibonacci extension level. And wouldn’t you know it… it ties out to current 2015 Dow Jones resistance levels/highs. Note as well that the monthly closing high came in February at 18,132 (a mere 58 points away).
Applying Fibonacci levels to these key dates, and we can come up with a 1.61 Fib extension level of around 18,190. This becomes a breakout/resistance zone for the Dow Jones.
Every time the market has rallied up into this Dow Jones resistance area, it has backed off a bit. The big question now is whether or not the Dow be able to breakout above this level?
Many are aware that the Dow Jones simply represents 30 stocks and is not always a great tool for measuring broader U.S. markets. But we must also keep in mind that the same Fibonacci level (161 percent) applied to the S&P 500 has held it in check throughout 2015 as well.
Will the Dow Jones and S&P 500 be able to breakout above their recent highs and the 1.618 Fib price resistance levels? A breakout for both would be viewed as a positive event, so keep them on your radar going forward. Thanks for reading and best of luck out there.
Twitter: @KimbleCharting
Author does not have a position in any mentioned securities at the time of publication. Any opinions expressed herein are solely those of the author, and do not in any way represent the views or opinions of any other person or entity.


