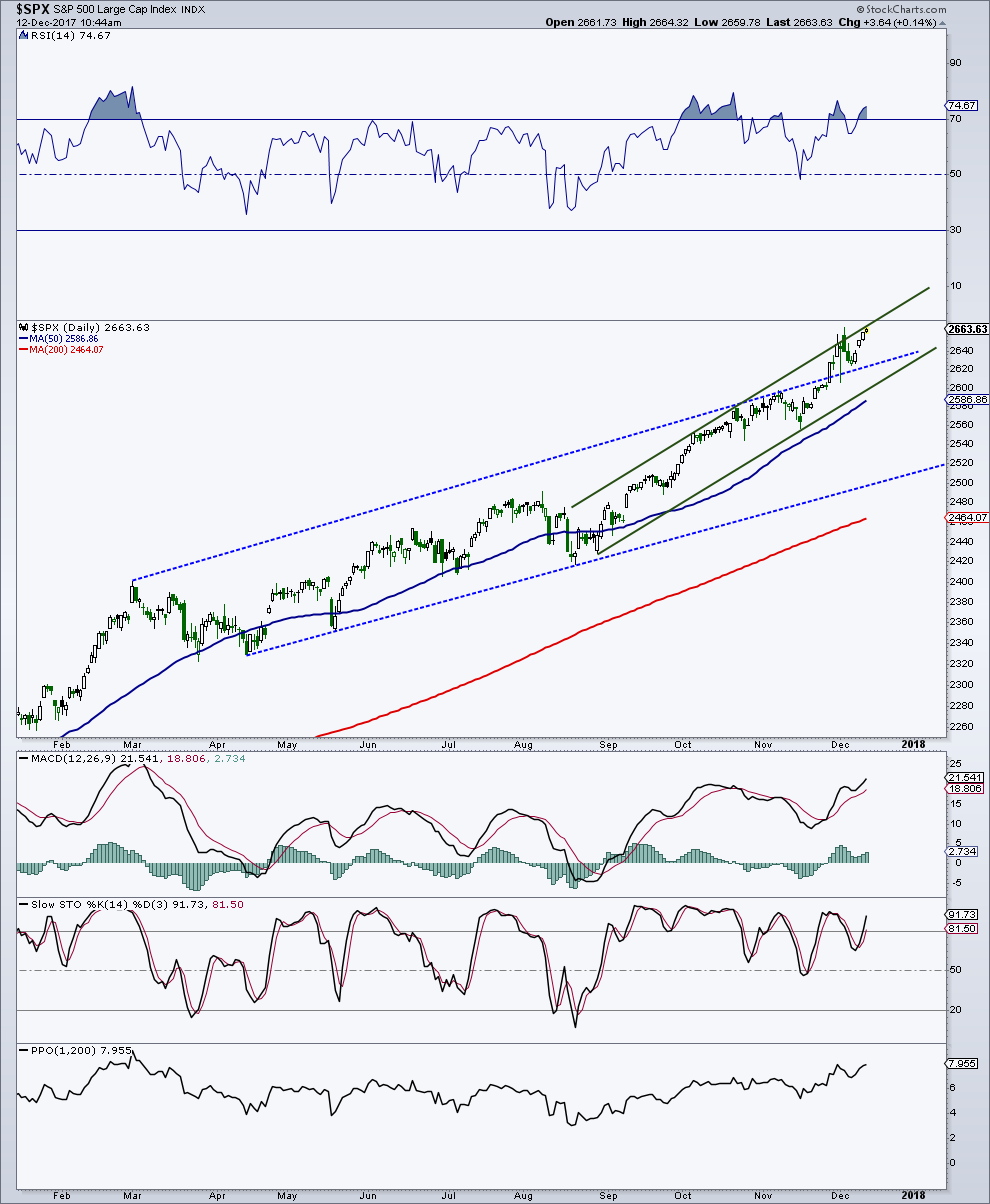
The stock market has definitely heated up recently and is certainly something to keep an eye on.
A better way of putting it, perhaps, is that investors are heating up toward the stock market.
A couple weeks ago, I noted that the S&P 500 Index (SPX) rose above its weekly Bollinger Band (on an intraweek basis) for the first time since last December. The index then took a brief break and fell back inside its Bollinger bands on both a daily and weekly basis (that was a good sign).
But we are off and running again… and we do not want to see parabolic price action for the major indices. While it is fun while it lasts, it never lasts for too long. And often doesn’t end well.
S&P 500 Chart
There are a number of measurements that target the 2,650 to 2,700 price range as a potential top for the S&P 500. However, I still do not see the deterioration under the surface that is normally seen as tops are traced out. Additionally, we most likely need to see a very large pickup in volatility for a major stock market top to occur. Or, of course, we could see a parabolic blowoff to the upside to mark the end.
Feel free to reach out to me at arbetermark@gmail.com for inquiries about my newsletter “On The Mark”. Thanks for reading.
Twitter: @MarkArbeter
The author has a position in related securities at the time of publication. Any opinions expressed herein are solely those of the author, and do not in any way represent the views or opinions of any other person or entity.


