Key Stock Market Takeaways:
- December is typically strong for stocks according to historical stock market seasonality.
- The lack of evidence of cyclical low being in place may not prevent rally attempts into year-end, which could be led by small-caps and international stocks.
- The market breadth backdrop is still challenging.
- Pessimism has risen but does not look washed out.
December has a well-known history as being a strong month of the year per stock market seasonality patterns.
In fact, it is the strongest month of the year for U.S. stocks on an absolute basis. Stocks have rallied over the course of the month about three-quarters of the time.
Interestingly, relative to the rest of the world, December is one of the weakest months of the year for U.S. stocks (seeing outperformance less than half the time).
Seasonal tendencies alone may not be sufficient to look for stocks to rise into year-end. Combined with some positive breadth and momentum divergences, it could be enough to fuel rally attempts as we head toward 2019. We do not have evidence that a meaningful cyclical low is in place, and the character of any rally attempts that do emerge will be watch closely.
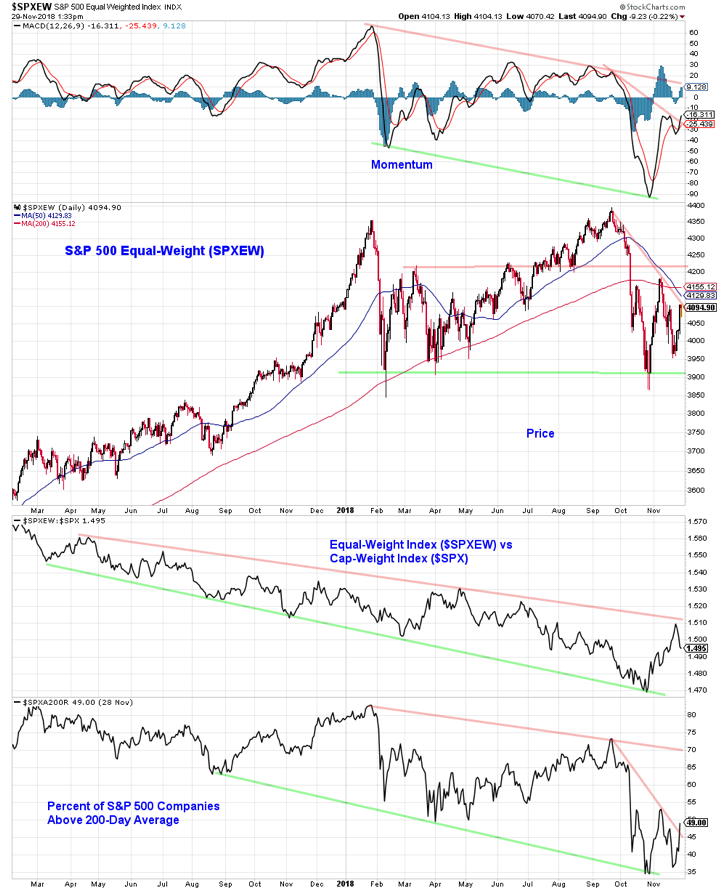
In some ways, the price trends for the equal-weight S&P 500 are worse than for the cap-weight index (the 50-day average has already crossed below the 200-day average, for example). Since the late October lows, however, price and momentum on an equal-weight basis have seen more substantial improvement and the equal-weight index has rallied sharply relative to the cap-weight index. With momentum and breadth breaking above near-term down-trend lines, price could continue to challenge resistance levels.
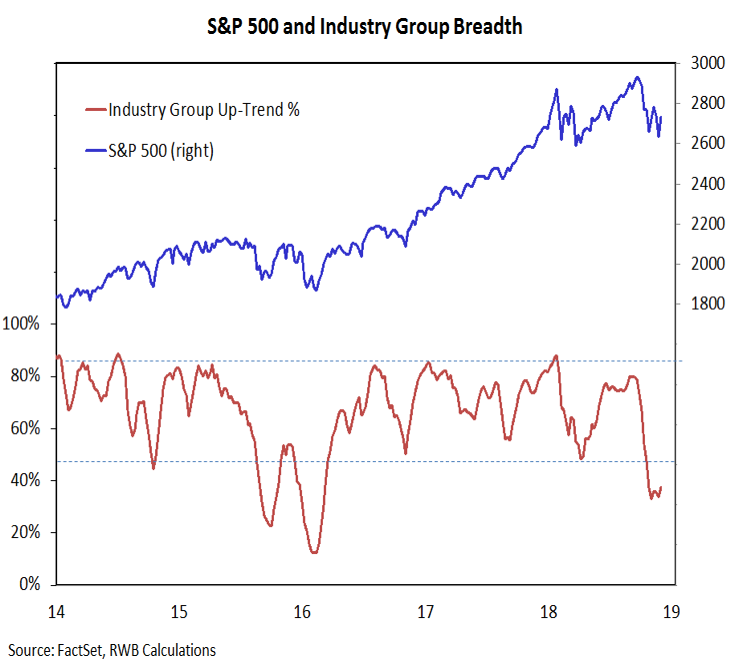
While the percentage of stocks trading above their 200-day averages has bounced since late October, industry group trends have shown little aggregate improvement and are at a level last seen during the 2015-2016 cyclical bear market. If a December rally does emerge, the degree of improvement in this indicator will be watched closely for evidence that the breadth backdrop is improving.
With the evidence increasingly suggesting stocks have entered a cyclical bear market, we are looking for evidence that challenges that view and improving breadth is high on that list. On a shorter-term basis, our sector-based trend indicator has been slow to respond to index-level strength (that indicator is updated weekly in our Market & Sector Trend Summary).
Evidence that historical seasonal patterns are going to hold and stocks are going to rally over the course of December could come in the form of market leadership. As mentioned above, while U.S. stocks typically move higher in December, they are typically chasing international stocks.
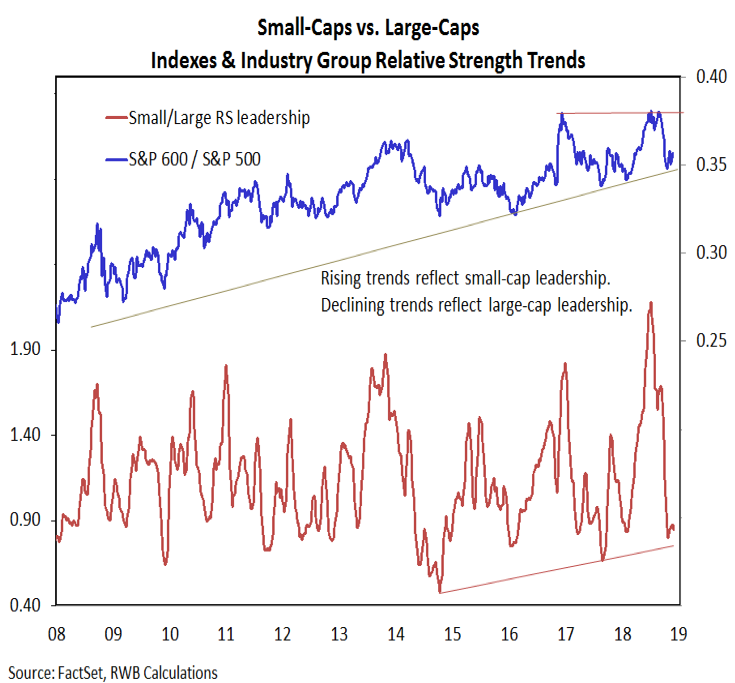
As we have mentioned in the past, post mid-term election seasonal strength is typically marked by both pronounced small-cap leadership relative to large-caps and fading leadership from defensive sectors. So far we have yet to see either of these materialize. At neither the index level nor the industry group relative strength level have small-caps shifted higher relative to large-caps. Coming into this week, our sector work showed continued relative leadership from Real Estate, Utilities, Consumer Staples, and Health Care.
With longer-term price, breadth and momentum trends deteriorating, we likely need to see some degree of panic selling followed by a meaningful breadth thrust to argue that the cyclical backdrop is shifting. Panic selling is not likely to emerge in an environment where pessimism is not widespread.
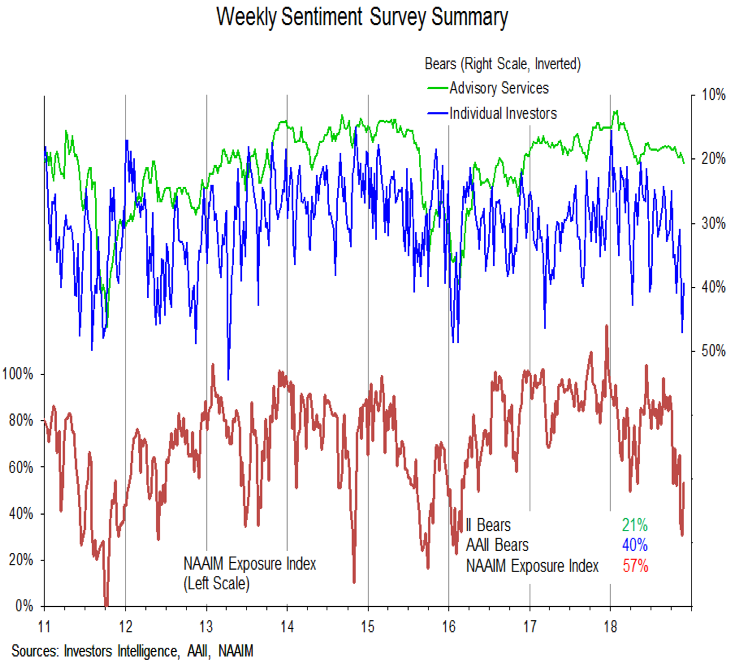
We are starting to see investors take a more cautious stance toward the stock market, though at this point it appears to be more of a moment of concern than a decisive shift toward pessimism and fear. AAII bears last week surged to 47% but this week backed down to 40%. Likewise, the NAAIM Exposure index jumped this week to 53% after falling to 30% last week. Bears on the II survey have been more muted, and at just 21% are not even at their highest level of 2018.
While pessimism by some of these measures has reached it highest level since early 2016, more appropriate benchmarks may be the extremes associated with the 2015/16 cyclical bear market (as well as the cyclical bear that emerged in 2011). This would suggest looking for at least 48% bears on the AAII survey, the NAAIM Exposure index in the teens, and a bull-bear spread on the II survey that is negative (mostly recent it was +18%).
Further evidence that sentiment is washed out would be a marked increase in the percentage of people expecting stock prices to decline over the next year. Right now it is less than 25%. In 2016 it got above 35% and in 2011 it soared to 50%. It is hard to suggest that pessimism is widespread when three-quarters of investors expect stocks to go up next year.
Twitter: @WillieDelwiche
Any opinions expressed herein are solely those of the author, and do not in any way represent the views or opinions of any other person or entity.

