A special thank you to Brett Freeze of Global Technical Analysis for his added research, analytical rigor and technical expertise.
There is an old story about a little boy who was such an extreme optimist that his worried parents took him to a psychiatrist. The doctor decided to try to temper the young boy’s optimism by ushering him into a room full of horse manure.
Promptly the boy waded enthusiastically into the middle of the room saying, “I know there’s a pony in here somewhere!”
Such as it is with markets these days.
Finding Opportunity
These days, we often hear that the financial markets are caught up in the “Everything Bubble.” Stocks are overvalued, trillions in sovereign debt trade with negative interest rates, corporate credit, both investment grade, and high yield seem to trade with far more risk than return, and so on. However, as investors, we must ask, can we dig through this muck and find the pony in the room.
To frame this discussion, it is worth considering the contrast in risk between several credit market categories. According to the Bloomberg-Barclays Aggregate Investment Grade Corporate Index, yields at the end of January 2020 were hovering around 2.55% and in a range between 2.10% for double-A (AA) credits and 2.85% for triple-B (BBB) credits.
That means the yield “pick-up” to move down in credit from AA to BBB is only worth 0.75%. If you shifted $1 million out of AA and into BBB, you should anticipate receiving an extra $7,500 per year as compensation for taking on significantly more risk. Gaining only 0.75% seems paltry compared to historical spreads, but in a world of microscopic yields, investors are desperate for income and willing to forego risk management and sound judgment.
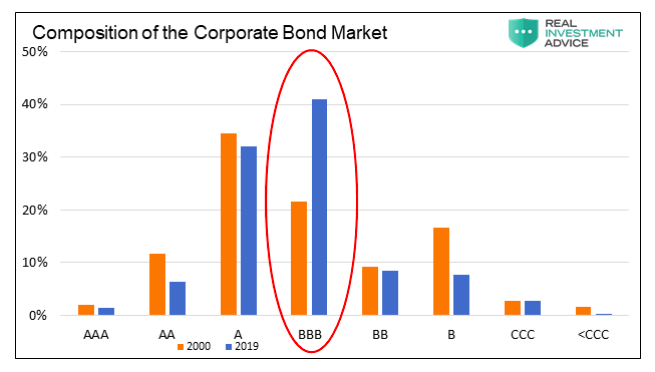
As if the poor risk premium to own BBB over AA is not enough, one must also consider there is an unusually high concentration of BBB bonds currently outstanding as a percentage of the total amount of bonds in the investment-grade universe. The graph below from our article, The Corporate Maginot Line, shows how BBB bonds have become a larger part of the corporate bond universe versus all other credit tiers.

In that article, we discussed and highlighted how more bonds than ever in the history of corporate credit markets rest one step away from losing their investment-grade credit status.
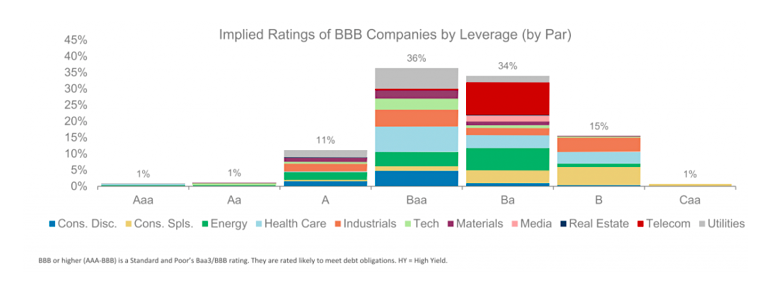
Furthermore, as shared in the article and shown below, there is evidence that many of those companies are not even worthy of the BBB rating, having debt ratios that are incompatible with investment-grade categories. That too is troubling.

A second and often overlooked factor in evaluating risk is the price risk embedded in these bonds. In the fixed income markets, interest rate risk is typically assessed with a calculation called duration. Similar to beta in stocks, duration allows an investor to estimate how a change in interest rates will affect the price of the bond. Simply, if interest rates were to rise by 100 basis points (1.00%), duration allows us to quantify the effect on the price of a bond. How much money would be lost? That, after all, is what defines risk.
Currently, duration risk in the corporate credit market is higher than at any time in at least the last 30 years. At a duration of 8.05 years on average for the investment-grade bond market, an interest rate increase of 1.00% would coincide with the price of a bond with a duration of 8.05 to fall by 8.05%. In that case a par priced bond (price of 100) would drop to 91.95.
Yield Per Unit of Duration
Those two metrics, yield and duration, bring us to an important measure of value and a tool to compare different fixed income securities and classes. Combining the two measures and calculating yield per unit of duration, offers unique insight. Specifically, the calculation measures how much yield an investor receives (return) relative to the amount of duration (risk). This ratio is similar to the Sharpe Ratio for stocks but forward-looking, not backward-looking.
In the case of the aggregate investment-grade corporate bond market as described above, dividing 2.55% yield by the 8.05 duration produces a ratio of 0.317. Put another way, an investor is receiving 31.7 basis points of yield for each unit of duration risk. That is pretty skinny.
After all that digging, it may seem as though there may not be a pony in the corporate bond market. What we have determined is that investors appear to be indiscriminately plowing money into the corporate credit market without giving much thought to the minimal returns and heightened risk. As we have described on several other occasions, this is yet another symptom of the passive investing phenomenon.
Our Pony
If we compare the corporate yield per unit of duration metric to the same metric for mortgage-backed securities (MBS) we very well may have found our pony. The table below offers a comparison of yield per unit of duration ratios as of the end of January:

Clearly, the poorest risk-reward categories are in the corporate bond sectors with very low ratios. As shown, the ratios currently sit at nearly two standard deviations rich to the average. Conversely, the MBS sector has a ratio of 0.863, which is nearly three times that of the corporate sectors and is almost 1.5 standard deviations above the average for the mortgage sector.
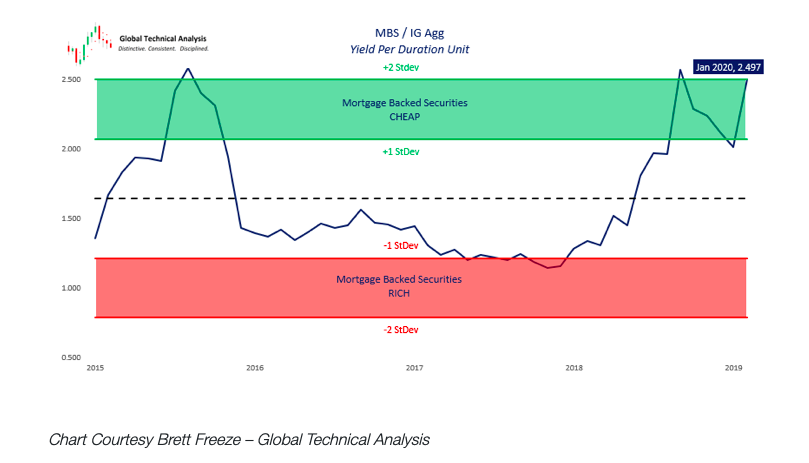
The chart below puts further context to the MBS yield per unit of duration ratio to the investment-grade corporate sector. As shown, MBS are at their cheapest levels as compared to corporates since 2015.

MBS, such as those issued by Fannie Mae and Freddie Mac, are guaranteed against default by the U.S. government, which means that unlike corporate bonds, the bonds will always mature or be repaid at par. Because of this protection, they are rated AAA. MBS also have the added benefit of being intrinsically well diversified. The interest and principal of a mortgage bond are backed by thousands and even tens of thousands of different homeowners from many different geographical and socio-economic locations. Maybe most important, homeowners are desperately interested in keeping the roof over their head
In contrast, a bond issued by IBM is backed solely by that one company and its capabilities to service the debt. No matter how many homeowners default, an MBS investor is guaranteed to receive par or 100 cents on the dollar. Investors of IBM, or any other corporate bond, on the other hand, may not be quite so lucky.
It is important to note that if an investor pays a premium for a mortgage bond, say a 102-dollar price, and receives par in return, a loss may be incurred. The determining factor is how much cash flow was received from coupon payments over time. The same equally holds for corporate bonds. What differentiates corporate bonds from MBS is that the risk of a large loss is much lower for MBS.
Summary
As the chart and table above reveal, AAA-rated MBS currently have a very favorable risk-reward when compared with investment-grade corporate bonds at a comparable yield.

Although the world is distracted by celebrity investing in the FAANG stocks, Tesla, and now corporate debt, our preference is to find high quality investment options that deliver excellent risk-adjusted returns, or at a minimum improve them.
This analysis argues for one of two outcomes as it relates to the fixed income markets. If one is seeking fixed income credit exposure, they are better served to shift their asset allocation to a heavier weighting of MBS as opposed to investment-grade corporate bonds. Secondly, it suggests that reducing exposure to corporate bonds on an outright basis is prudent given their extreme valuations. Although cash or the money markets do not offer much yield, they are always powerful in terms of the option it affords should the equity and fixed income markets finally come to their senses and mean revert.
With so many assets having historically expensive valuations, it is a difficult time to be an optimist. However, despite limited options, it is encouraging to know there are still a few ponies around, one just has to hold their nose and get a little dirty to find it.
Twitter: @michaellebowitz
Any opinions expressed herein are solely those of the author, and do not in any way represent the views or opinions of any other person or entity.


