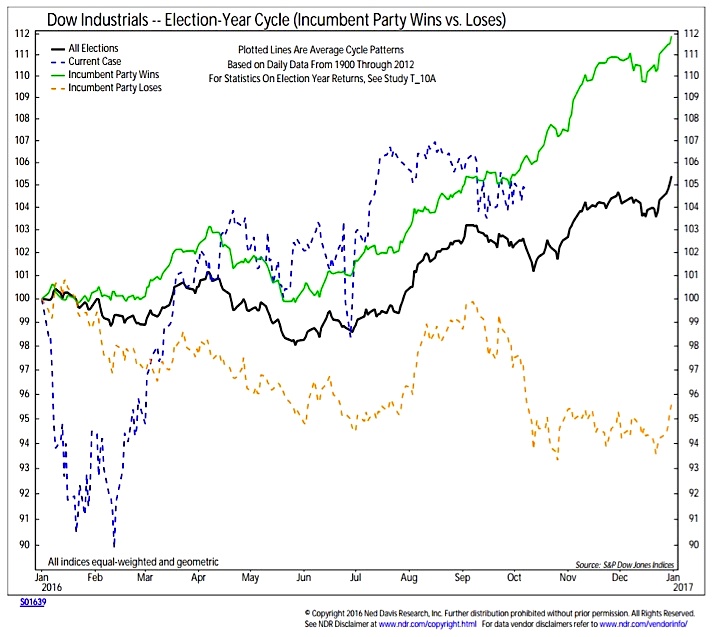
Seasonal Patterns/Trends are neutral. We are nearing the conclusion of the 2016 presidential election. The unconventional nature of this current election season has us (and it appears the market) circumspect about jumping to conclusions about the outcome of the race for president. As such, the remaining weeks ahead of the election could be volatilte, and the likelihood of further October surprises seems to be higher than average.
The calendar, though, favors the bulls. Regardless of the outcome of the election, history suggests stocks will celebrate its conclusion. While this trend is true for stocks overall, it is even more pronounced for small-caps relative to large-caps. Small-caps have already been gaining strength (from both a relative price and breadth perspective), and the passage of the election could help accelerate that trend.
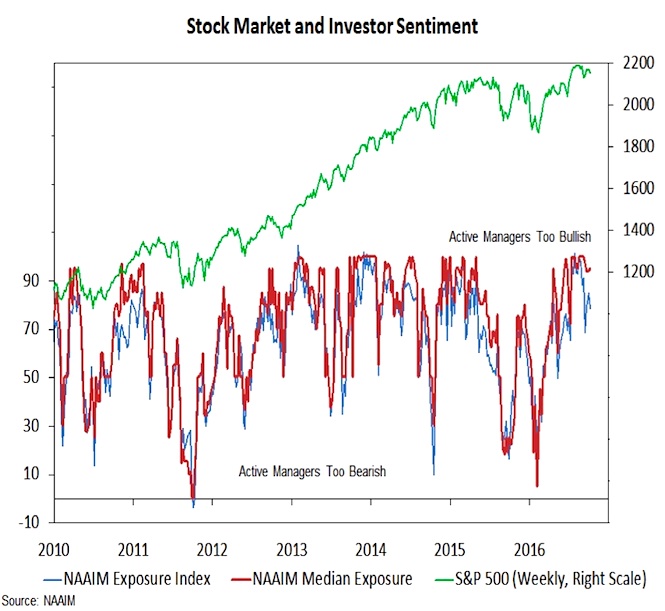
Investor sentiment shows excessive optimism which, from a contrarian perspective, is bearish. We have seen some evidence that near-term indicators have moved from excessive optimism to neutral or even excessive pessimism. But that has been the exception rather than the norm. One of the more reliable measures of sentiment from our perspective is the NAAIM exposure index, which measures equity exposure among active investment managers. While the index itself has fallen slightly in recent weeks, the median equity exposure remains elevated (above 90%). At the February market lows, the median exposure was at 5% and as recently as early July it was only 72%. With active managers fully invested, there is little available cash on the sidelines that can be put to work.
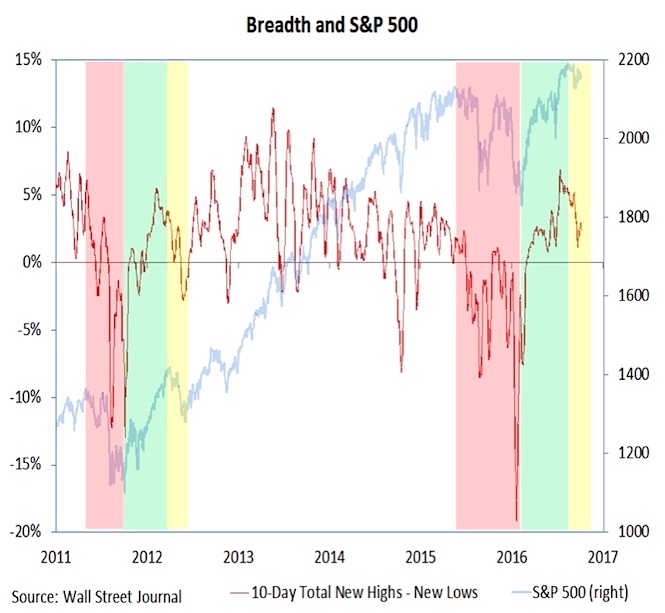
Broad market trends remain bullish from a longer-term perspective. Evidence of this can be seen in the night-and-day difference between 2016 and 2015. Last year, breadth measures failed to confirm rallies and the longer-term pattern of lower highs and lower lows could be seen when looking at the number of stocks making new highs (shown here) or the percentage of industry groups in uptrends. The rally off of the February 2016 lows came with these indicators breaking out to the upside. That upside momentum has been lost as stocks have worked sideways since their early July peak. We see this as evidence that the consolidation/correction has not yet come to completion rather than arguing that we have witnessed a fundamental break-down in the behavior of the broad market.
Nasdaq Composite
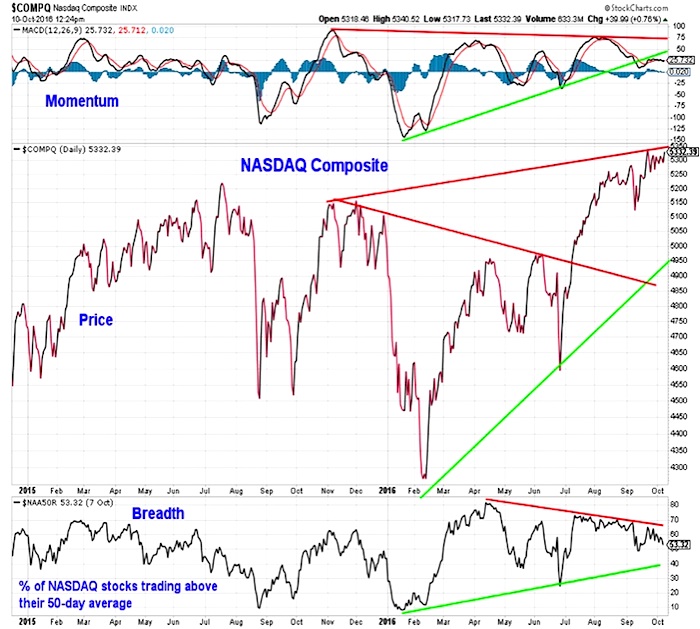
A closer look at the NASDAQ Composite can provide more clarity about the current long-term/short-term dynamics that are playing out in the stock market. The rally off of the February lows had been accompanied by generally expanding momentum and improved breadth. This has helped carry the index to new all-time highs. However, as the index has drifted further into record territory, momentum has stalled (falling below the up-trend line off of the February lows) and breadth has failed to show continued improvement. After peaking above 80% in April, the percentage of NASDAQ stocks trading above their 50-day averages peaked below 70% this summer and is now shy of 60%. An expansion in the number of stocks trading above their 50-day averages (and an increase in stocks making new highs) would be evidence that short-term breadth trends have gotten back in gear.
Sector Strength
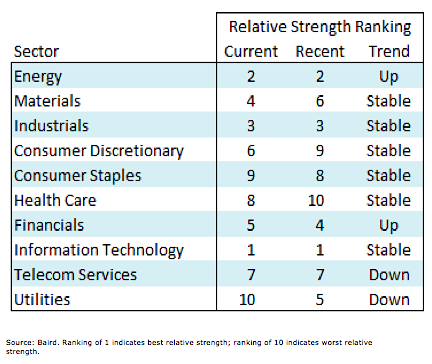
Our sector-level relative strength rankings show a continued move toward cyclical and economically sensitive leadership at the expense of the defensive areas of the market that have attracted attention (and investor dollars) for the first part of the year. The Utilities sector has shown significant deterioration in the rankings (in June and July, it was consistently in one of the top two spots) and remains vulnerable to a continued drift higher in bond yields. Continued improvement in the Financials sector (in July and August, it was consistently in one of the bottom two spots) is an encouraging barometer for the stock market overall. Leadership from Technology and Industrials (which with Energy round out the top three spots currently) suggests economic conditions may be improving as we move toward 2017.
Thanks for reading.
Twitter: @WillieDelwiche
Any opinions expressed herein are solely those of the author, and do not in any way represent the views or opinions of any other person or entity.

