This is an Intermarket Analysis chart review that I provided to my fishing club members this past weekend which graphically represents relationships (strong and weak) that can foretell how the currents are moving to better identify how stocks/sectors/indices will move!
You can see my last Intermarket Chart Attack here. Note my caption was “careful”
Let’s review the charts again…
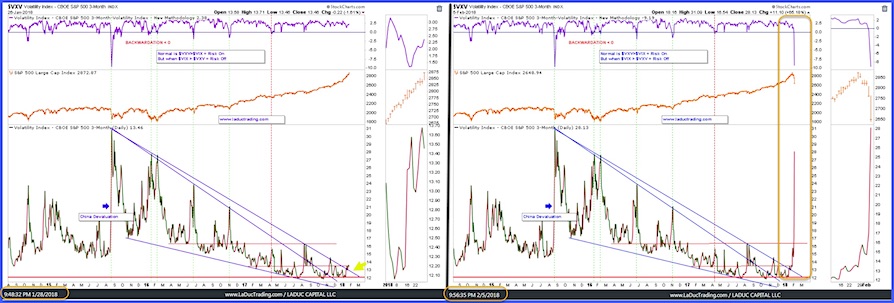
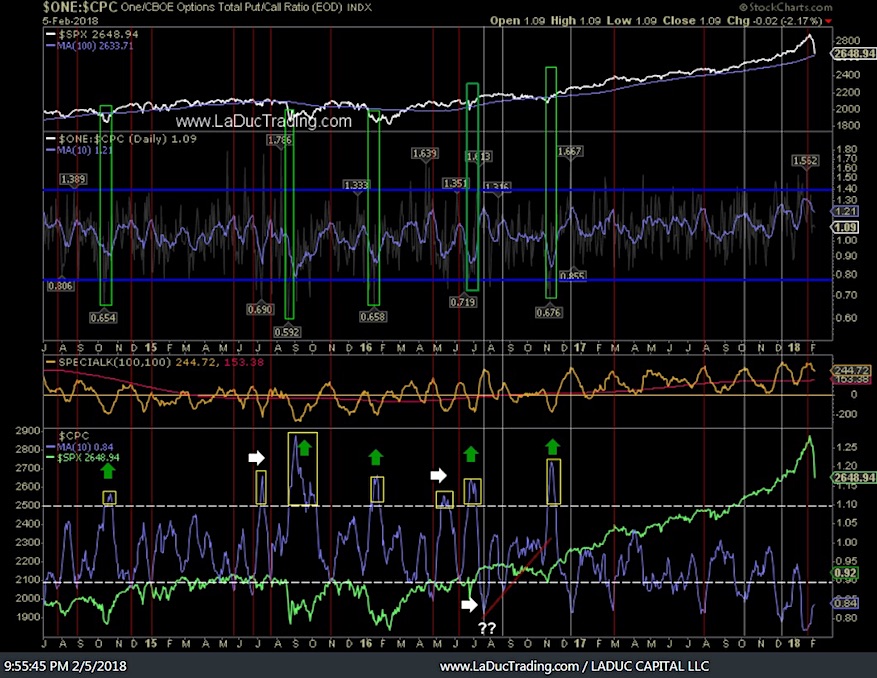
Volatility of Volatility: Then And Now.
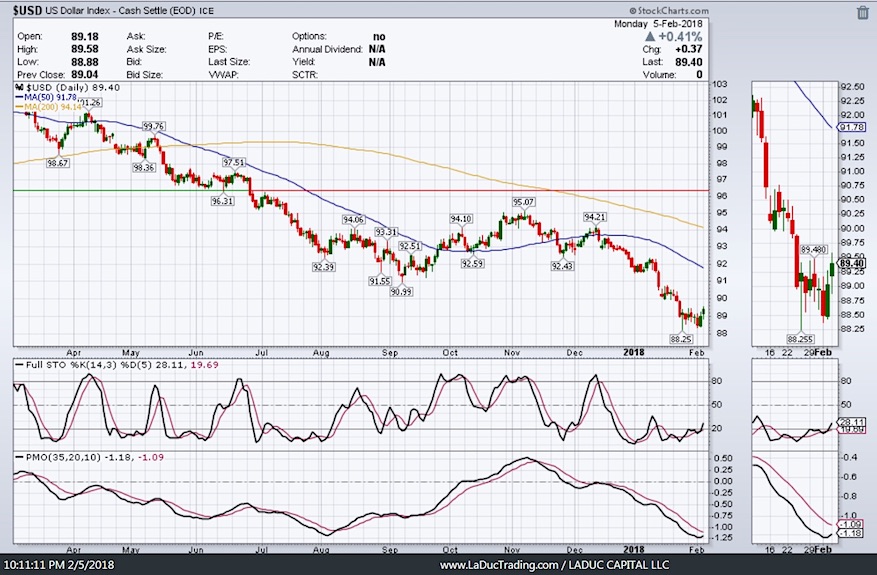
The safe-haven trade will likely be into the USD. It has only just started to turn:
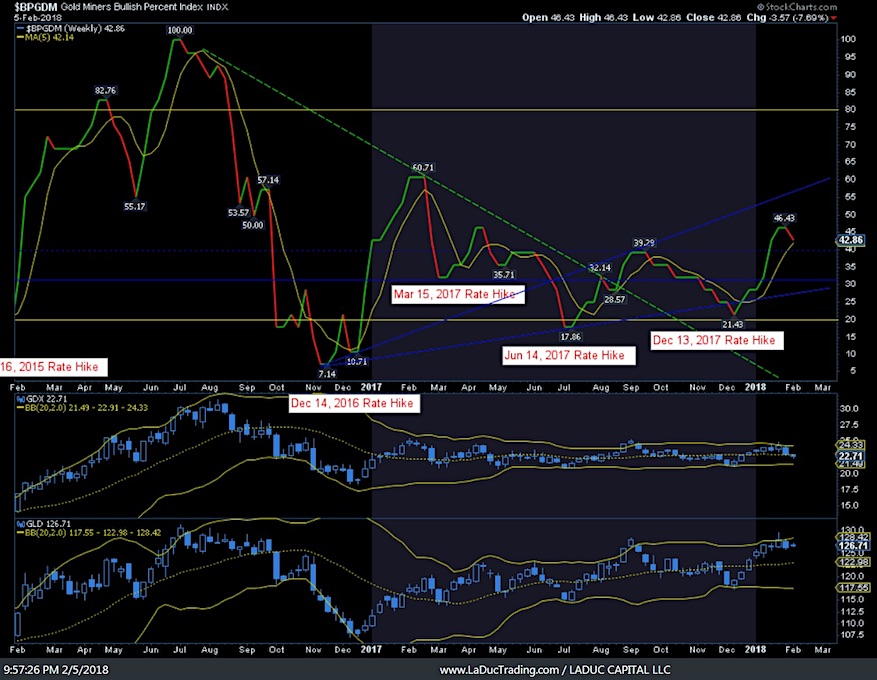
And with that commodities, metals and miners likely fall.
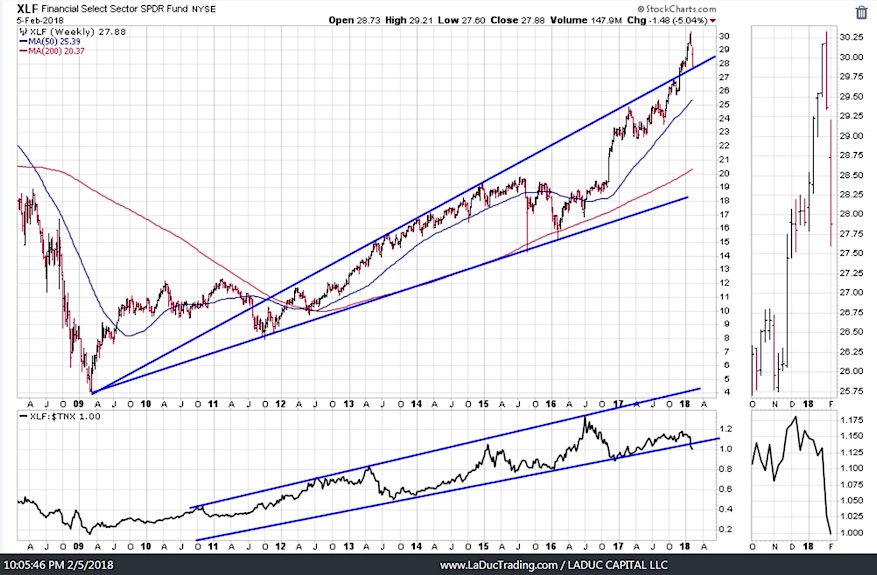
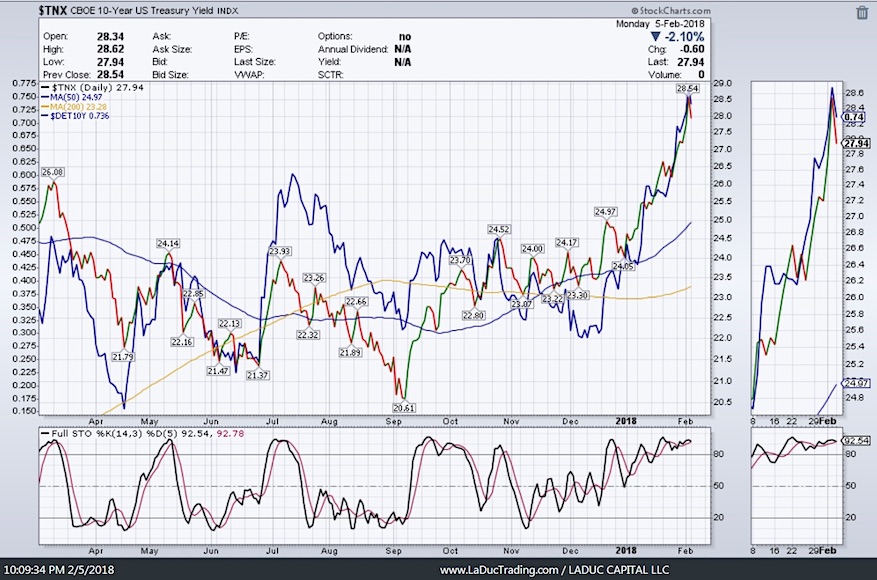
Rates have run hard and fast. Getting ready for a turn down and with it watch financials short and TLT long:
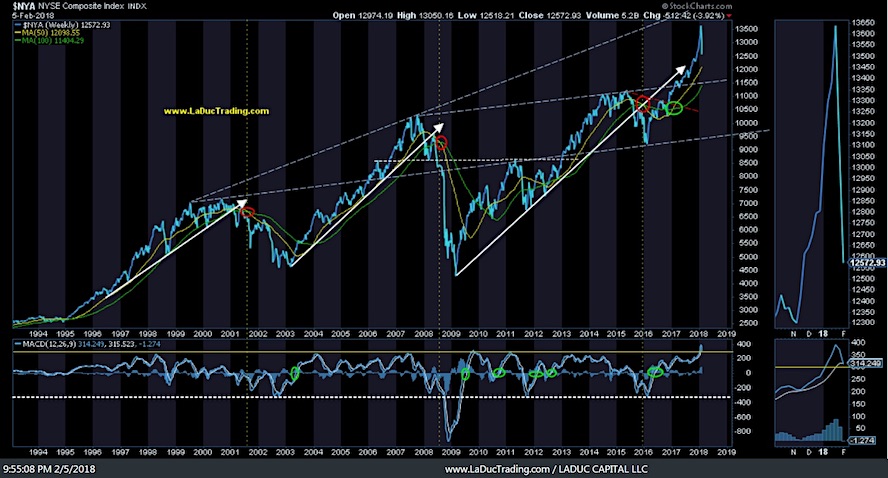
Outliers Revert With Velocity
Not Done
Not Done
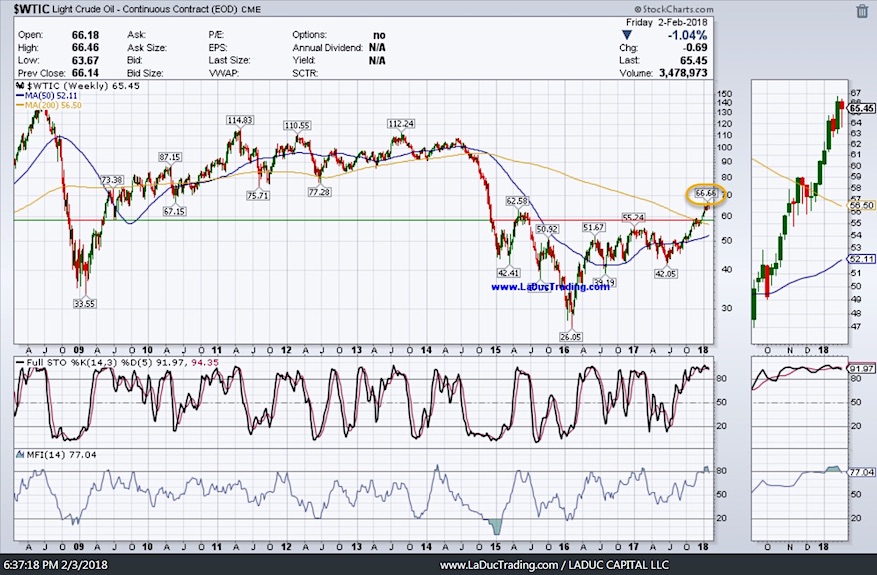
Crude at $66.66 was just too tempting not to short. It’s just starting I believe.
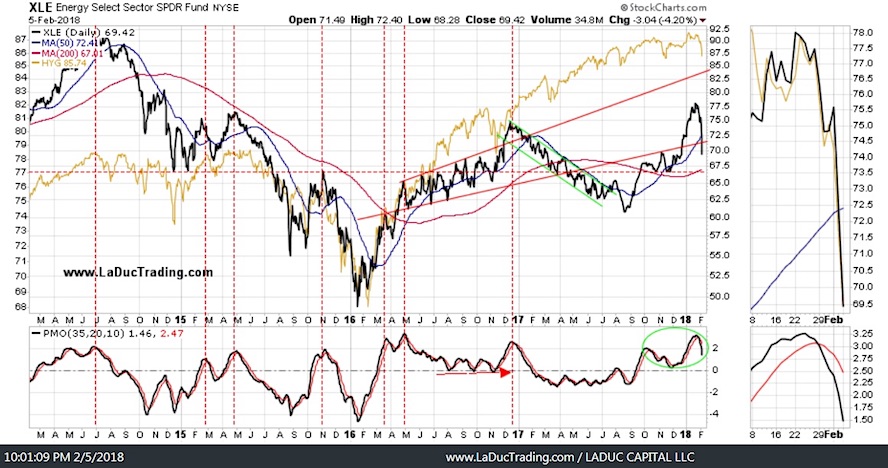
Last week I said I liked $XLE short $75 to $70 but I didn’t think it would happen quite so quickly. Likely bounces near $67 as $HYG makes its way to $85.
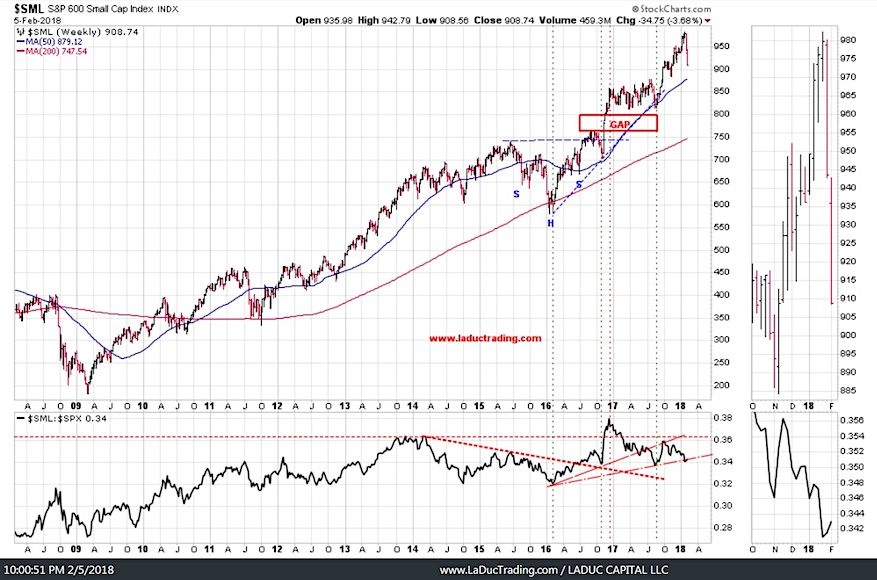
There will be more shorting opportunities in the indices but from slightly higher levels…theme remains: Careful.
Happy Trading.
Come join me… I made it super easy for you to trade with me: 1. Pop into my LIVE Trading Room any time you want. 2. Get real-time Portfolio tracking of my trades with SMS/Email. 3. Think big picture with my macro-to-micro investment newsletter. You can also subscribe to my Free Fishing Stories Blog/Videos and find me @SamanthaLaDuc. Thanks for reading and Happy Trading!
Twitter: @SamanthaLaDuc
Any opinions expressed herein are solely those of the author, and do not in any way represent the views or opinions of any other person or entity.

