When I last looked at Intel Corp. (INTC), the stock had just put out strong earnings and was attempting to bounce after a 3 month decline of around 25 percent. At that time, the setup and earnings report looked good but we were waiting to see if the “big money” felt the same. As well, the stock price (at that time) was below it’s 50 day moving average and downtrend. Here’s an excerpt from that post:
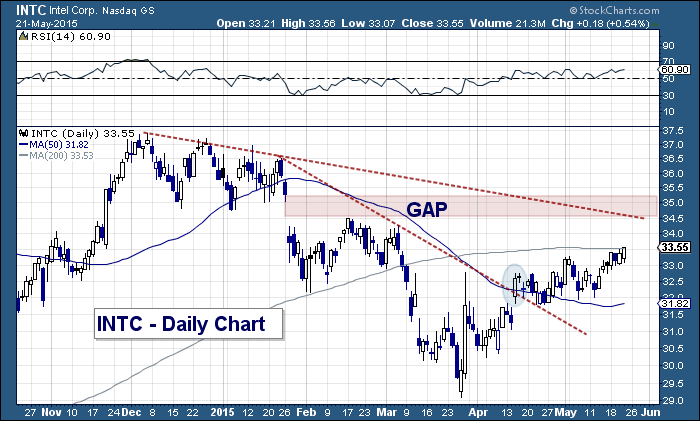
“…it’s a start. A key test will come tomorrow as the stock will likely test its 50 day moving average and downtrend line. A closing price above $32.50 would be constructive and potentially set the stock up for a run at the $34.50 level (the February highs and open gap).”
Fast forward to today, and you can see that Intel’s stock price has been moving higher in a constructive manner. After taking out the 50 day MA and downtrend line, it consolidated before pushing higher. It’s now testing its 200 day MA. A move above the 200 day would bring the open gap and lateral resistance into view around 34.50.
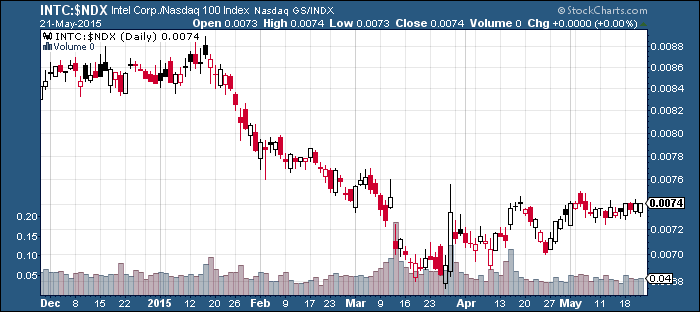
Note that the 50 day is trying to curl higher as well. This doesn’t mean that the stock is out of any dangers, but it’s a good sign that INTC is trying to build a base. Although the stock has underperformed the NASDAQ 100 (NDX) over the past 6 months, it has shown relative strength of late.
Intel Corp (INTC) Stock Chart
INTC:NDX Relative Strength Ratio Chart
It will be interesting to watch INTC battle its 200 day MA. On the one hand, retests from the underside can prove to be tricky and offer resistance. And on the other hand, we have an open gap over head that is acting like a magnet. It may not get “filled” in the near-term but it will likely entice the stock for a kiss.
Thanks for reading and trade safe.
Twitter: @andrewnyquist
The author does not have a position in any of the mentioned securities at the time of publication. Any opinions expressed herein are solely those of the author, and do not in any way represent the views or opinions of any other person or entity.


