The following are non-commercial futures trading positions as of May 23, 2017.
Note that the data were released in the May 26 COT Report (Commitment of Traders).
10-year note
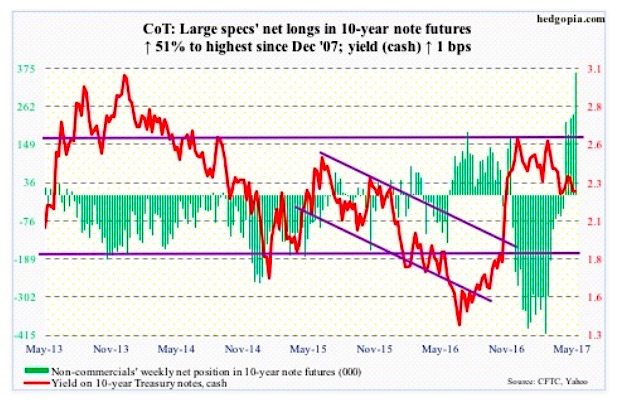
May 26 COT Report: Currently net long 362.5k, up 122.5k.
FOMC minutes for the May 2-3 meeting were released Wednesday. Post-statement, futures priced in 83 percent odds of a 25-basis-point hike in June (13-14), up from 79 percent pre-meeting.
Rather revealingly on Wednesday, 10- and two-year yields respectively fell three and two basis points to 2.26 percent and 1.29 percent. The latter peaked at 1.4 percent on March 14, when the Fed hiked the last time. Around that time, 10-year yields peaked at 2.62 percent.
The yield curve continues to tighten – 95 basis points on Friday versus 126 basis points on December 16, 2015 when the Fed hiked for the first time in 10-plus years. What is bothering the long end?
For one, it is likely beginning to worry about potential double tightening. This week, the FOMC did discuss ways to at least begin to unwind its $4.5-trillion balance sheet.
Realistically, though, double-tightening is not a likely scenario.
The U.S. economy is hardly booming and not in a position to cope with persistent – and two-pronged – decrease in accommodation. What is likely is the Fed stops raising rates before it begins to taper the balance sheet. A June hike brings the Fed funds rate to a range of 100 to 125 basis points. Even if the Fed moves in September, the Fed funds rate gets to about 140 basis points. Too soon to say if this is enough of a cushion before the balance sheet is tapered.
30-year bond
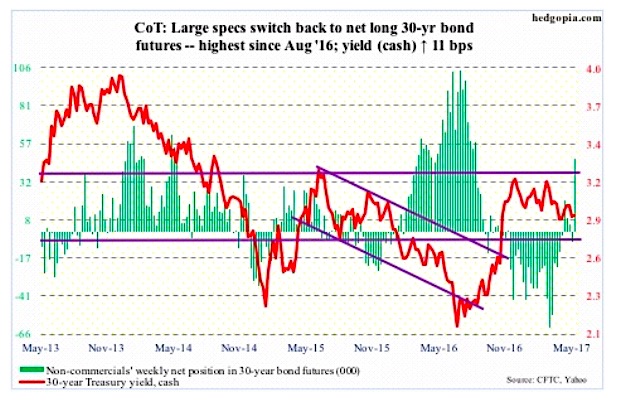
May 26 COT Report: Currently net long 47.3k, up 54.1k.
Major economic releases next week are as follows.
Markets are closed Monday for observance of Memorial Day.
Tuesday brings personal income and outlays (April) and the S&P Corelogic Case-Shiller housing market index (March).
Core PCE (personal consumption expenditures) – the Fed’s favorite measure of consumer inflation – softened year-over-year in March to 1.56 percent from 1.77 percent in February. The last time core PCE grew north of two percent was in April 2012. The recent deceleration has given ammunition to FOMC doves.
Nationally, U.S. home prices rose 5.8 percent y/y in February – the fastest rate since June 2014. Prices have consistently increased at four to five percent range since then.
The pending home sales index for April is published on Wednesday. March declined nine-tenths of a point month-over-month to 111.4. The cycle high – and a 10-year high – 113.6 was reached in April 2016.
The ISM manufacturing index (May) and productivity (1Q17, revised) come out on Thursday.
Manufacturing activity shrunk 2.4 points m/m in April to 54.8. February’s 57.7 was the highest since August 2014.
Preliminarily, 1Q17 non-farm business output per hour declined at a 0.6-percent annual rate, reversing a rise in productivity in the prior two quarters. This was the fourth drop in last six quarters.
May’s employment report is published on Friday. The economy added 211,000 non-farm jobs in April, averaging 185,000 in the first four months this year. Last year, the monthly average was 187,000, slower than 226,000 in 2015 and 250,000 in 2014.
Crude oil
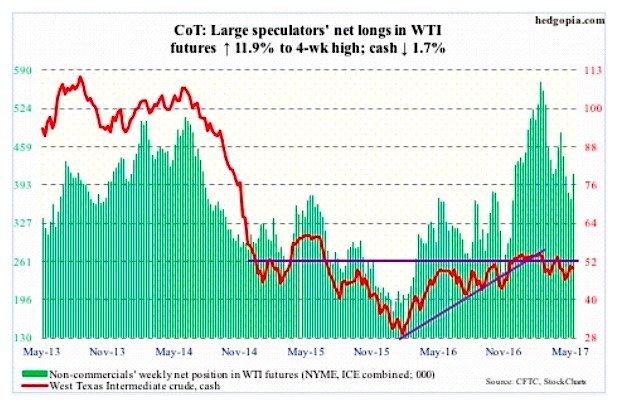
May 26 COT Report: Currently net long 411.8k, up 44k.
Spot West Texas Intermediate crude rallied to 51.88 on Wednesday before retreating. The session produced a spinning top. From intraday low to high during May 5-24, oil jumped north of 12 percent.
The rally stopped just prior to testing three-month trend line resistance. Come Thursday, it collapsed 4.8%.
Oil stopped going up even as OPEC/non-OPEC ministers were in discussion to extend the existing production cutback agreement by another nine months until 1Q18. As well, the EIA report out Wednesday once again contained lots of positives.
For the week ended May 19, stocks of crude, gasoline and distillates all fell – respectively by 4.4 million barrels to 516.3 million barrels, 787,000 barrels to 239.9 million barrels, and 485,000 barrels to 146.3 million barrels.
Crude imports dropped 296,000 barrels per day to 8.3 million b/d. Refinery utilization inched up one-tenth of a point to 93.5 percent.
On the other hand, crude production rose 15,000 b/d to 9.3 mb/d. Since OPEC reached a cutback agreement late November last year, U.S. crude production has increased by 621,000 b/d.
E-mini S&P 500
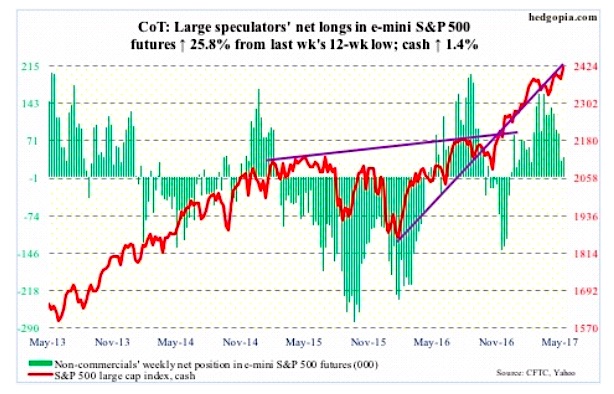
May 26 COT Report: Currently net long 40.4k, up 8.3k.
The buy-the-dip crowd saved the day – again. Off the Comey/Trump one-day selloff last week through Thursday’s all-time high of 2418.71, the cash rallied 2.8 percent.
All this without much help from flows.
In the week to Wednesday, SPY, the SPDR S&P 500 ETF (NYSEARCA:SPY), lost $1.5 billion (courtesy of ETF.com). In the past four, $10.2 billion was redeemed.
In the same week, $10.1 billion came out of U.S.-based equity funds – $17.1 billion in the past four (courtesy of Lipper).
Thursday, the S&P 500 kissed the daily upper Bollinger band. In the event of a breather, bulls need to defend 2400. Or the 50-day moving average (2372.52), for that matter.
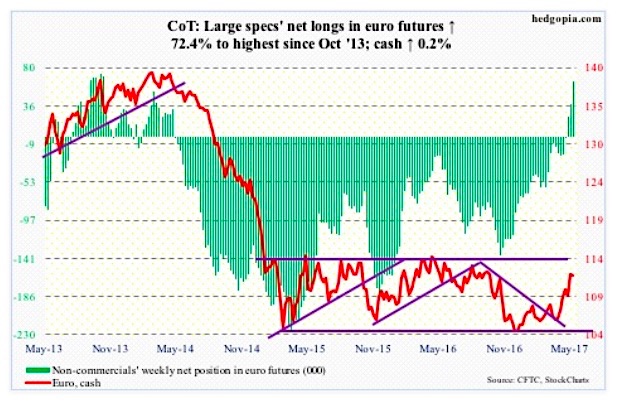
Euro
May 26 COT Report: Currently net long 64.8k, up 27.2k.
Mario Draghi, ECB president, dismissed concerns that loose monetary policy may be fuelling bubbles in the Eurozone. Time will be the judge of that assertion.
Here and now, after rallying nearly nine percent this year through Monday’s high of 112.6, the euro (cash) is beginning to give out signs of fatigue.
In the meantime, a golden cross – in which the 50-day crosses the 200-day from below and considered bullish – just formed on the currency. Buyer beware: the pattern does not always pan out.
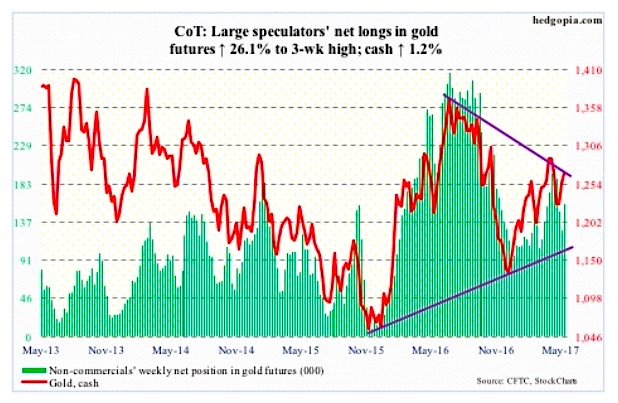
Gold
May 26 COT Report: Currently net long 159.8k, up 33k.
Gold (cash), too, now has a golden cross. Gold bugs defended both these averages this week.
From low to high between last December and April this year, the metal rallied north of 15 percent, and is currently trapped in a 10-month symmetrical triangle, which likely decides the next trend.
For now, in the week through Wednesday, GLD, the SPDR gold ETF (NYSEARCA:GLD), lost $180 million (courtesy of ETF.com).
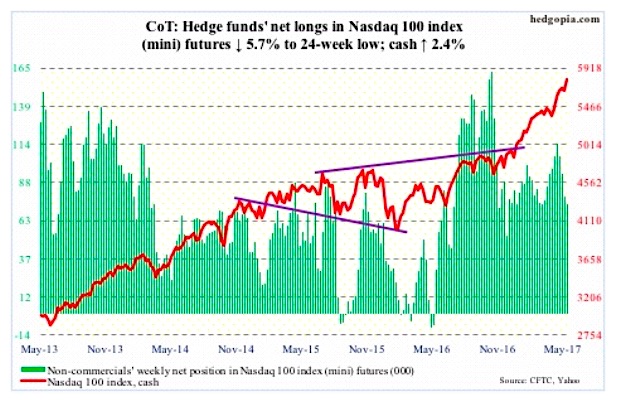
Nasdaq 100 index (mini)
May 26 COT Report: Currently net long 74.1k, down 4.5k.
The energizer bunny that is the Nasdaq 100 keeps chugging higher. Yet another high on Thursday (5793.13) on the cash.
The 10-day which last week looked like it was itching to go lower is pointing up again, with the index moving further and further away from 5450 – first layer of decent support.
Things are beyond extended. Barring a brief drop below in April, the weekly RSI has been in the 70s for nearly four months now. That said, this also points to prevailing momentum.
In the week ended Wednesday, QQQ, the PowerShares Nasdaq 100 ETF (NASDAQ:QQQ), attracted $394 million (courtesy of ETF.com).
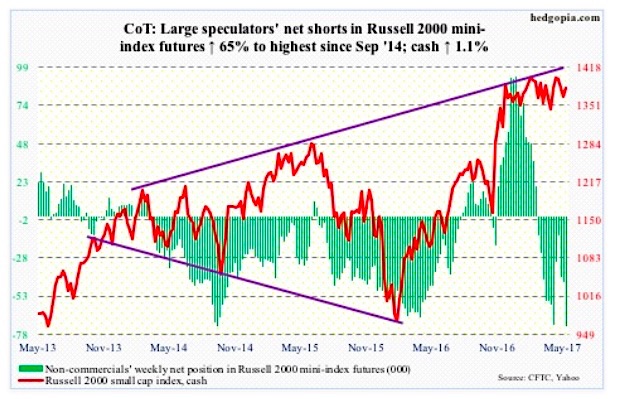
Russell 2000 mini-index
May 26 COT Report: Currently net short 72.5k, up 28.6k.
After rallying three percent from last week’s low through Thursday’s high, the cash – essentially range bound between 1390s and 1340s for nearly six months – got stopped at resistance.
The Russell 2000 continues to act the weakest of major U.S. indices. Small-cap bulls did retake the 50-day this week but are struggling to build on it. Flows are not helping.
In the week ended Wednesday, IWM, the iShares Russell 2000 ETF (NYSEARCA:IWM), lost $1.8 billion. In the prior two weeks, $2.4 billion was withdrawn (courtesy of ETF.com).
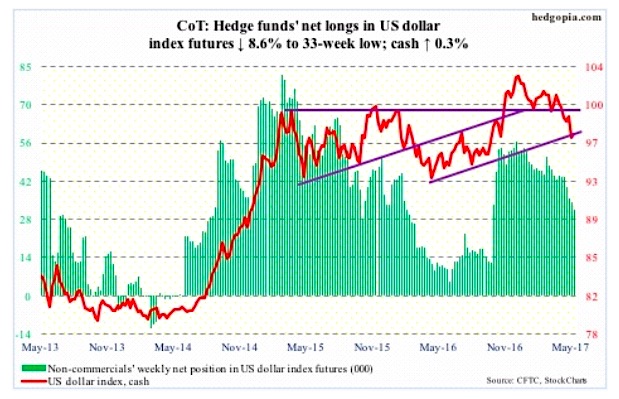
US Dollar Index
May 26 COT Report: Currently net long 31.3k, down 3k.
The cash (97.36) is trying hard to stabilize, and likely succeeds – at least near term. For the last several sessions, it has gone sideways near the daily Bollinger band. This week’s low approximates the bottom of a five-month downward-sloping channel. This gives dollar bulls some room to maneuver.
Resistance is galore – 99.20 (seven-month horizontal resistance), 100 (underside of broken May 2016 rising trend line), and 100.7 (range top going back to March 2015).
Medium-term, non-commercials continue to act tentative, having cut net longs to a 33-week low.
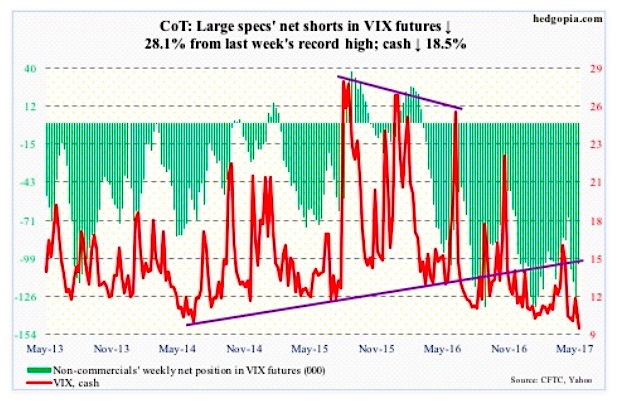
VIX
May 26 COT Report: Currently net short 102.4k, down 39.9k.
From an intra-day high of 15.71 six sessions ago to a low of 9.65 Friday, it was yet another instance of rapid volatility contraction after a spike reversal.
Thursday, the cash closed below 10. Ditto with Friday. This was the fourth such instance this month – and 13 overall. The VIX Volatility Index (INDEXCBOE:VIX) goes back to January 1990. That is how rare it is.
It is also safe to assume that once VIX (9.81) drops this low, the path of least resistance is up. It is just a matter of if it lingers around here or shoots right back up.
Twitter: @hedgopia
Author may hold a position in mentioned securities at the time of publication. Any opinions expressed herein are solely those of the author, and do not in any way represent the views or opinions of any other person or entity.

