Current data suggests that inflation has been in our everyday lives for several months. And today’s Producer Price Index data was pretty ugly.
BUT… could inflation be peaking?
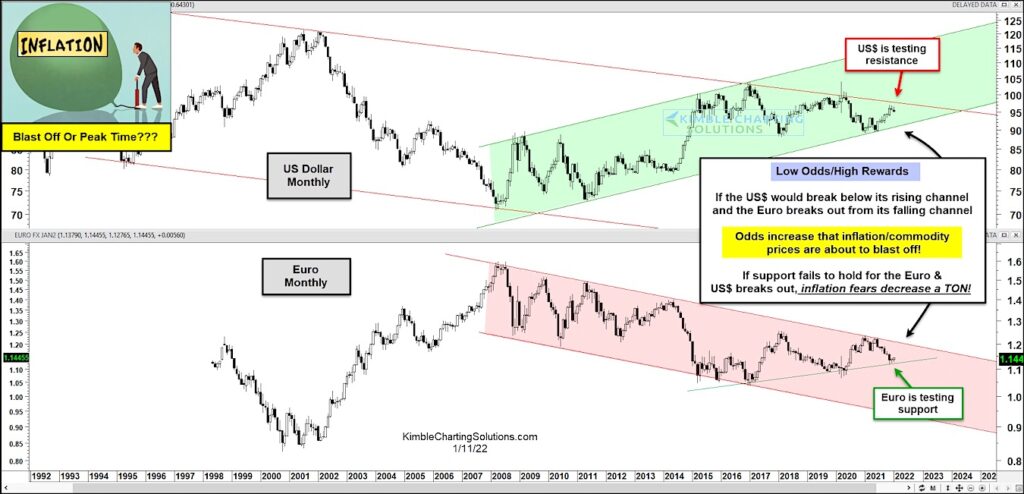
Today’s chart 2-pack offers a glimpse of why inflation could subside over the near-term.
Here we look at the “monthly” chart of the US Dollar and Euro currencies. It’s pretty easy to see the rising trend channel for the US Dollar and falling trend channel for the Euro. As well, both currencies have formed a wedge pattern, with the US Dollar testing resistance and the Euro testing support.
Should the US Dollar break out to the upside (Euro break to downside), then inflation would likely subside. However, if the US dollar turns lower and breaks its own support, then inflation could take off.
Seems like a pretty important pennant pattern to watch. Stay tuned!
Euro and US Dollar “monthly” Chart

Note that KimbleCharting is offering a 2 week Free trial to See It Market readers. Just send me an email to services@kimblechartingsolutions.com for details to get set up.
Twitter: @KimbleCharting
Any opinions expressed herein are solely those of the author, and do not in any way represent the views or opinions of any other person or entity.


