The financial markets have been volatile this year, to say the least. And much of the volatility has been tied to inflationary concerns and rising interest rates via the Federal Reserve.
That said, we’ve come to a point in time where it appears that inflation may be easing. And that should be music to the ears of everyday consumers.
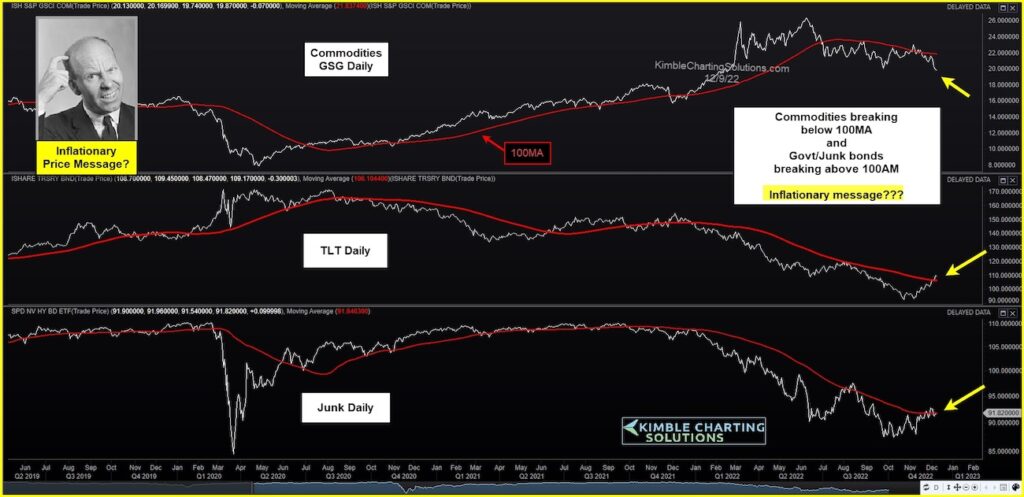
Today, we share a chart highlighting the price of commodities versus bonds to underscore the potential for lower prices going forward.
As you can see, the price of commodities is dropping, and recently broke below its 100 day moving average. At the same time, government bonds and junk bonds are moving higher and breaking above the 100 day moving average.
Taken together, it appears that inflation is chilling here. And, if so, this could be a boon for consumers. Stay tuned!
S&P Commodities (GSC), Treasuries (TLT), and Junk Bonds (JNK) Chart

Note that KimbleCharting is offering a 2 week Free trial to See It Market readers. Just send me an email to services@kimblechartingsolutions.com for details to get set up.
Twitter: @KimbleCharting
Any opinions expressed herein are solely those of the author, and do not in any way represent the views or opinions of any other person or entity.


