I pay attention to specific, price defined levels of support (demand) and resistance (supply), looking for opportunities to trade around these levels based on a simple process for doing so.
I use two charts, the DAILY and WEEKLY, the former I use for entry, the latter for direction. Let’s take a look at a few WEEKLY charts on my radar for potential DAILY chart trades.
Lockheed Martin (NYSE:LMT)
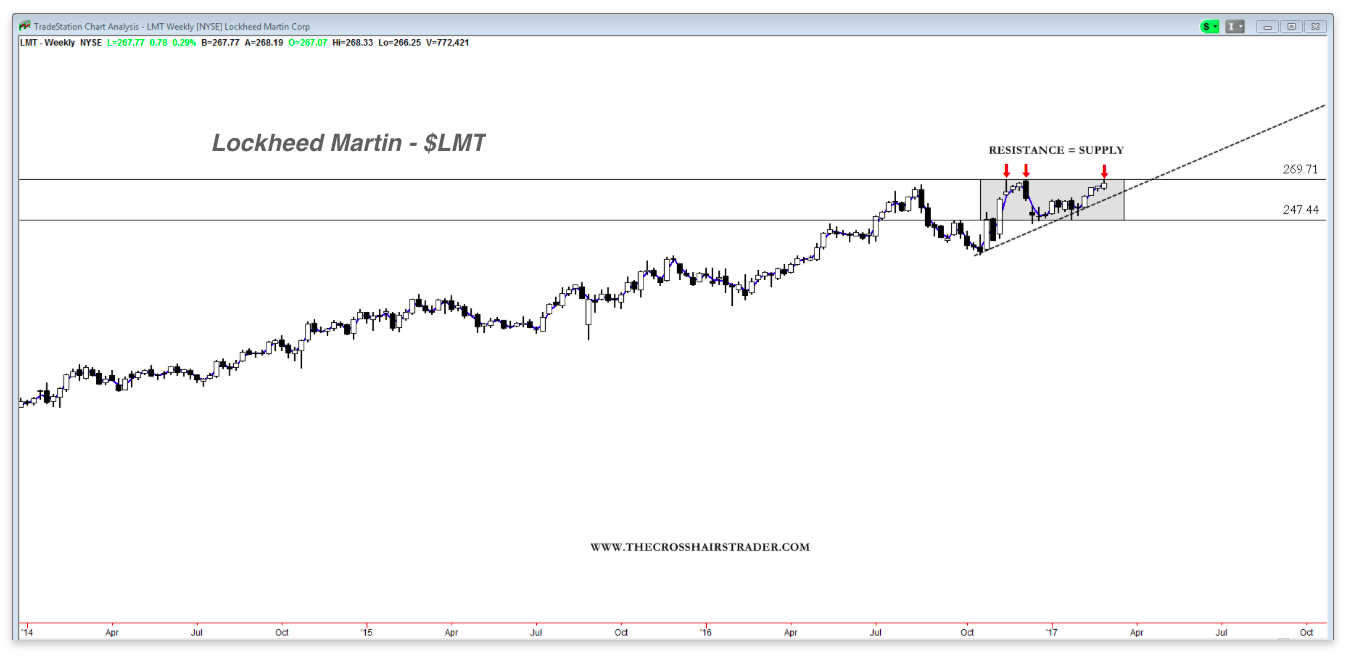
Lockheed Martin (LMT) has enjoyed a nice run this year right up to resistance and all time highs. I’ll be looking to go long if the old supply becomes new demand here, in the form of a breakout and trend continuation.
Abbott Laboratories (NYSE:ABT)
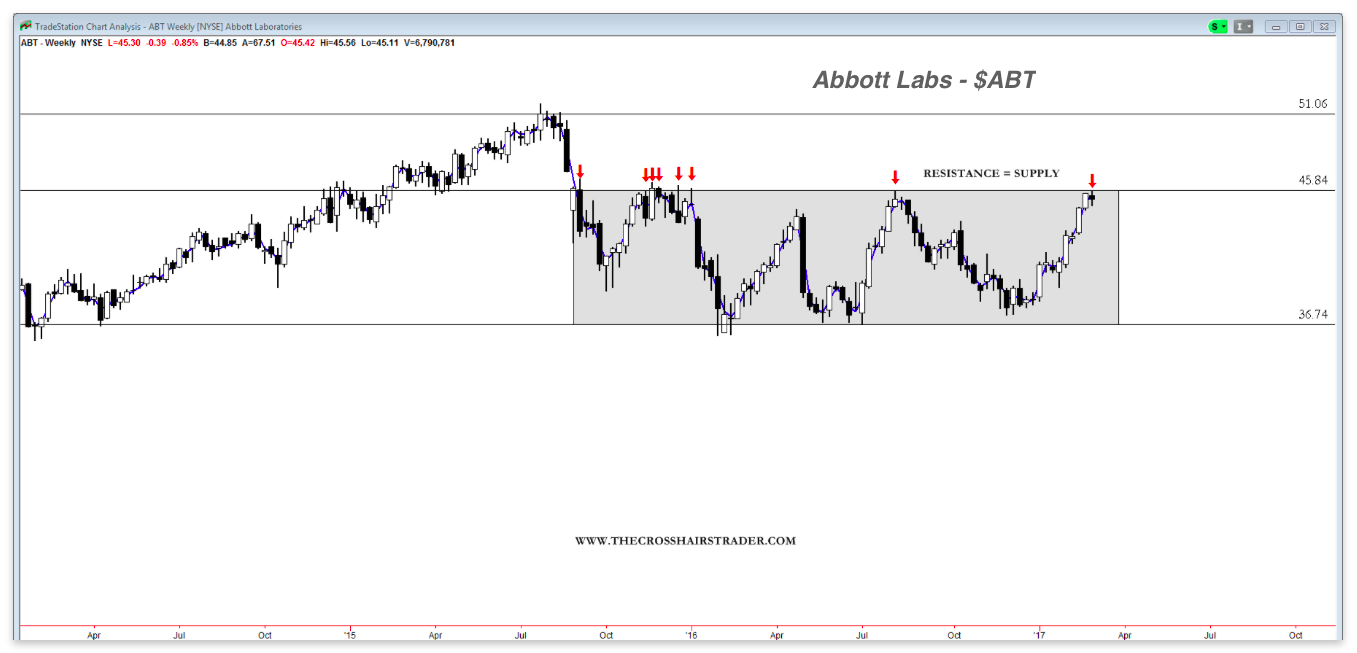
Abbott Labs (ABT) has traded within a wide range box since late 2015. It is now at the top of the box again after a strong sprint since January. I would like to see it take a rest here (and on the DAILY chart) for a new break (= new demand) and possible run back to Summer 2015 highs.
Hartford Financial (NYSE:HIG)
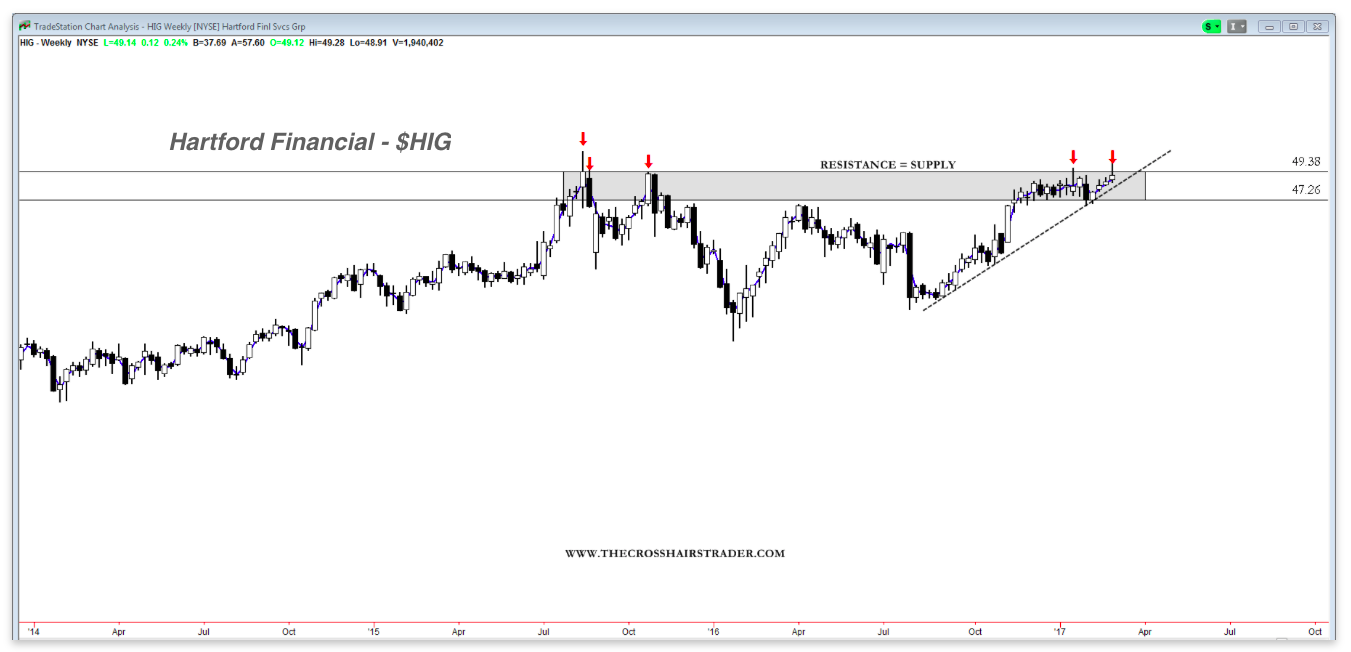
Hartford Financial (HIG) is sitting right at a key price resistance level from Summer 2015. I’ll be looking to go long if the old supply becomes new demand here, in the form of a breakout and trend continuation.
Take a look at the following stocks on the WEEKLY chart and see if they are exhibiting the same price action as the ones above: JNJ MCD CRM CTRP HUN WWE ABC LYV GWPH.
Thanks for reading and note that you can access more of my work over at CrosshairsTrader.
Twitter: @crosshairtrader
No positions in any of the mentioned securities at the time of publication. Any opinions expressed herein are solely those of the author, and do not in any way represent the views or opinions of any other person or entity.


