When market breadth turns south, savvy investors know that it’s time to remain cautious.
And that’s been the case for the past several weeks. And it’s looking perhaps even worse today.
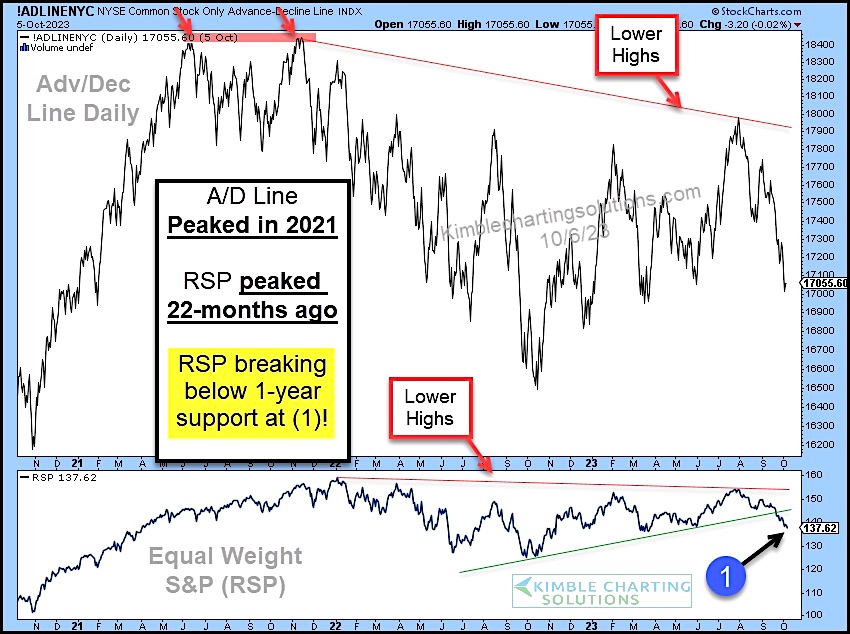
Below are charts of the NYSE Advance-Decline Line (upper pane) and the Equal Weight S&P 500 Index ETF (RSP).
With so many bulls in the media it’s a bit ironic that so many seem to wonder why the market is struggling and risk-on assets not doing well.
Note that the Advance-Decline Line peaked with a double top in 2021 and RSP peaked 22-months ago.
Furthermore, risk-on investors might want to keep an eye on what is happening with RSP at (1). It’s not looking so good right now. Stay tuned!
NYSE Advance/Decline Line and Equal Weight S&P 500 Index Charts

Note that KimbleCharting is offering a 2 week Free trial to See It Market readers. Just send me an email to services@kimblechartingsolutions.com for details to get set up.
Twitter: @KimbleCharting
Any opinions expressed herein are solely those of the author, and do not in any way represent the views or opinions of any other person or entity.


