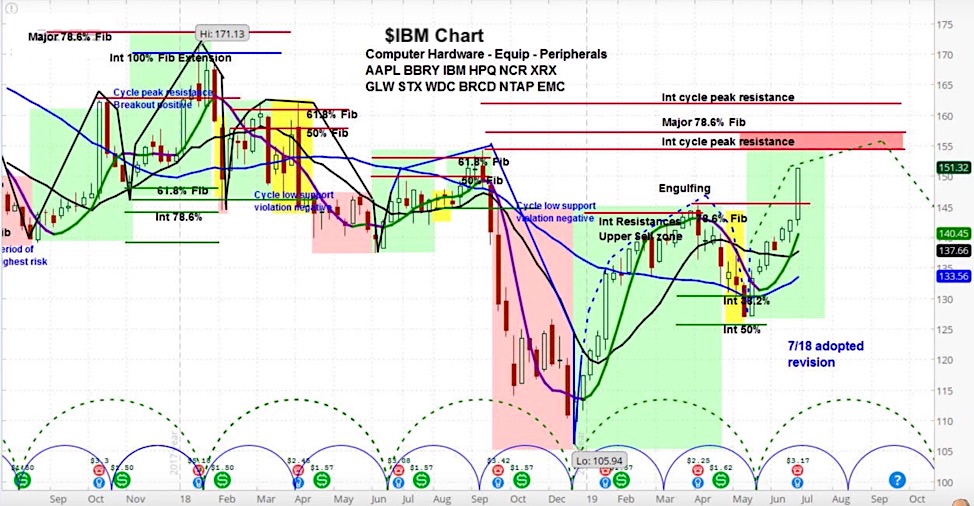
IBM Corporation (NYSE: IBM) Stock Weekly Chart
This week’s spotlight stock chart takes a look at an individual stock that moved significantly last week: IBM Corporation.
Up by nearly 5%, IBM Corporation (IBM) was one exception to the earnings trend highlighted in my weekend update.
The company beat earnings and met revenue expectations, while maintaining annual guidance.
Based on its market cycles, IBM is still in the rising phase of the current cycle.
Using Fibonacci analysis to identify a resistance zone, there is still a little more upside in the coming months. Note the smaller, minor cycles on the chart. It suggests there could be a shallow correction before the stock continues its move higher.
For more from Slim, or to learn about cycle analysis, check out the askSlim Market Week show every Friday on our YouTube channel.
Twitter: @askslim
Any opinions expressed herein are solely those of the author, and do not in any way represent the views or opinions of any other person or entity.


