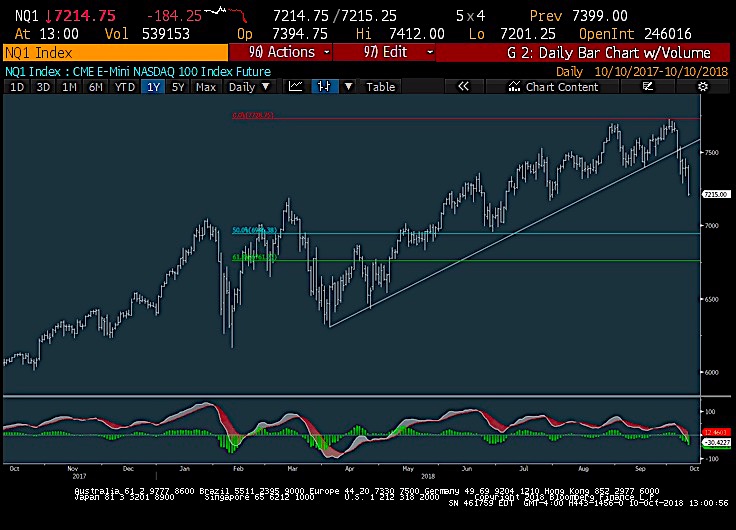
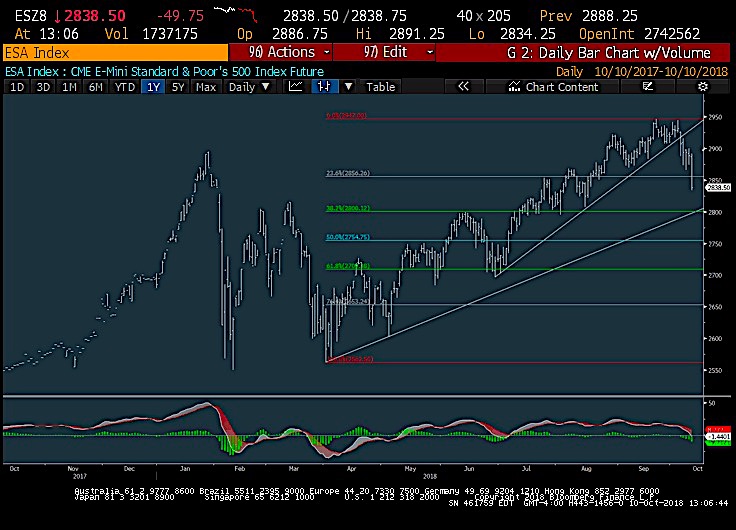
The S&P 500 (NYSEARCA:SPY), NASDAQ 100 (NASDAQ:QQQ), and Dow Jones industrials (NYSEARCA:DIA) all selling off after breaking support of the last few days and still early to think lows are in.
I was originally thinking that 2825-30 might be a target for the S&P 500… however, I am now thinking this is too high and prices will likely get down to 2800.
Note that 2800 is a 38.2 Fibonacci retracement of the prior rally. The Nasdaq could also reach its 50% Fibonacci target. See chart analysis below for more.
Market breadth is about 4/1 negative and nearly half the sectors are down more than 2% (at the time of this writing – early Wednesday afternoon). So we’re finally seeing the kind of selling that we’ve been looking for.
This should be a buying opportunity by sometime early next week. For now, though, it looks to be a bit early as additional selling still looks likely.
I’m favoring Utilities and avoiding Tech, Financials, and Industrials here over the short-term (3-5 days).
NASDAQ 100 Chart
Another 250-300 points lower is possible in NASDAQ 100 before any lows form.
Probably best to hold off on any long attempts until Friday/next Monday.
S&P 500 Chart
Today’s selling should lead to a bit more downside in the days ahead.
The area near 2800 makes sense for long attempts/short covering as this is the 38.2 Fibonacci retrace as well as a key 1×1 price/time angle
If you have an interest in seeing timely intra-day market updates on my private twitter feed, please follow @NewtonAdvisors. Also, feel free to send me an email at info@newtonadvisor.com regarding how my Technical work can add alpha to your portfolio management process.
Twitter: @MarkNewtonCMT
Author has positions in mentioned securities at the time of publication. Any opinions expressed herein are solely those of the author, and do not in any way represent the views or opinions of any other person or entity.


