With the stock market trading at all-time highs and seemingly pressing higher and higher by the month in 2024, it should come as no surprise that households across America are upping their exposure to equities.
More precisely, according to Ned Davis Research, stocks as a percent of household financial assets reached nearly 35% at the end of Q1 this year. A new all time high.
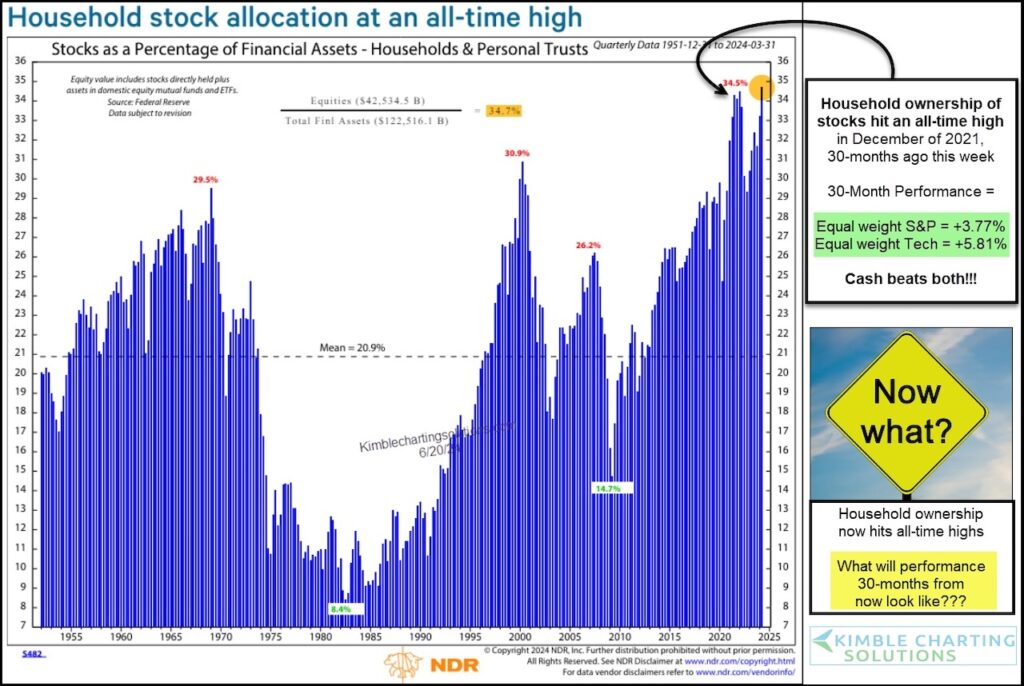
But there’s more… as you can see on the chart below, household ownership of stocks also hit all-time highs 30-months ago (end of Q4 2021).
So how have the past 30 months worked out? Let’s just say that the Q4 2021 all-time high proved to be a bit of a crowded trade for equity investors.
Looking at two important “equal weight” index ETFs – RSP (S&P 500) and QQEW (Nasdaq 100) – we can see that they have risen just 3.77% and 5.81% respectively over the past for 30 months. Even cash has outperformed!
Fast forward to today. Household ownership is now higher than it was 30 months ago (the highest in history). Do we have another crowded trade in equities? What will stock performance look like 30 months from now? Stay tuned!
Household Ownership of Equities – Ned Davis Research Chart
Note that KimbleCharting is offering a 2 week Free trial to See It Market readers. Just send me an email to services@kimblechartingsolutions.com for details to get set up.
Twitter: @KimbleCharting
The author may have a position in mentioned securities. Any opinions expressed herein are solely those of the author, and do not in any way represent the views or opinions of any other person or entity.

 Outlook and The Year of the Snake")
 Primed For A Turnaround?")


