In 1897, Virginia O’Hanlon asked her father if Santa Claus was real. He said she should ask The Sun, a prominent New York City newspaper of the day.
Back then there was no fake news apparently, so if the Sun put it in print that there was a Santa Claus, there must be a Santa Claus.
Francis Church, an editor for The Sun, penned the response which contained the now famous phrase “Yes, Virginia, there is a Santa Claus.”
As the holiday season rolls around, many investors have a similar question; will there be a Santa Claus rally for the stock market?
In this article, we examine historical data to see whether Saint Nick will provide holiday cheer to investors or the Grinch will foil their wishes.
The Santa Claus Rally
The Santa Claus Rally, also known as the December effect, is a term for the occurrence of more frequent than average stock market gains as the year winds down. For longer-term investors, this article serves as a whimsical note on what might or might not occur this December. Traders willing to measure trades in hours and days, not months or years, might find useful data in this article to make a few extra bucks. Regardless of your classification, we use the traditional disclaimer that past performance is not indicative of future results.
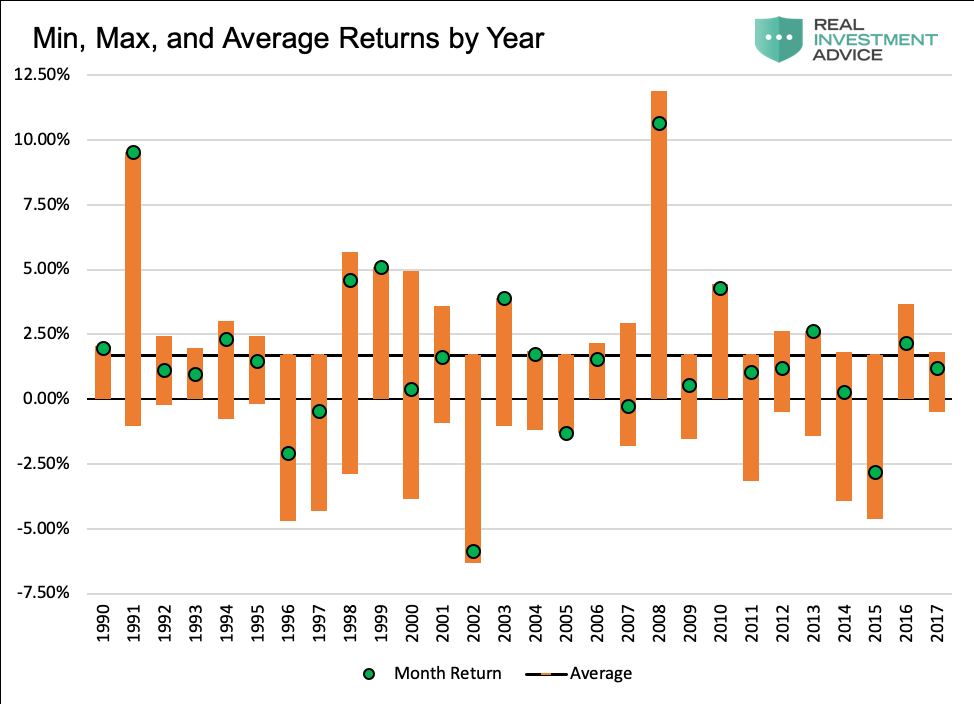
For this analysis, we studied data from 1990 to current to see if December is a better period to hold stocks than other months. The answer was a resounding “YES.” The 28 Decembers from 1990 to 2017, had an average monthly return of +1.70%. The other 11 months, 308 individual observations over the same time frame, posted an average return of +0.62%.
The following graph shows the monthly returns as well as the maximum and minimum intra-month returns for each December since 1990. It is worth noting that more than a third of the data points have returns that are below the average for the non-December months (+0.62%). Further, if the outsized gains of 2008 and 1991 are excluded, the average for December is +1.05%. While still better than the other months, it is not nearly as impressive as the aggregate 1.70% gain.
Data Courtesy Bloomberg
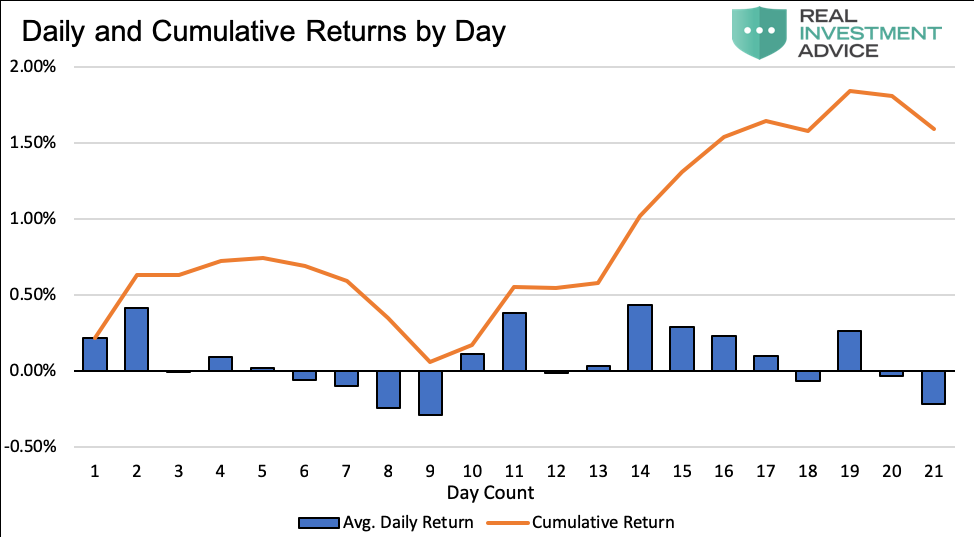
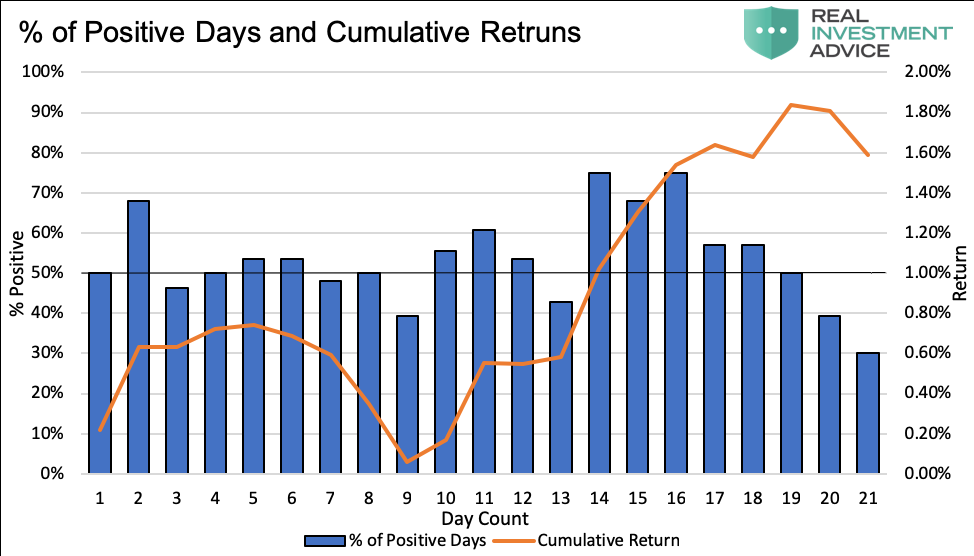
Next, we analyzed the data to explore if there were periods within December where gains were clustered. The following two graphs show, in orange, aggregate cumulative returns by day count for the 28 Decembers we analyzed. In the first graph, returns are plotted alongside daily aggregated average returns by day. Illustrated in the second graph is the percentage of positive days versus negative days by day count along with returns.
Data Courtesy Bloomberg
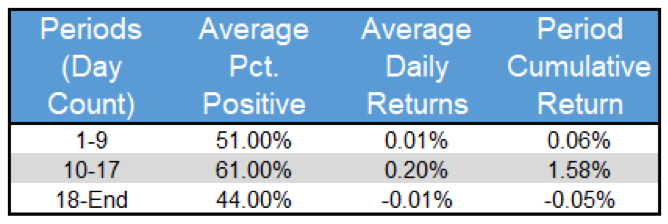
Visually one notices the “sweet spot” in the two graphs occurs between the 10th and 17th trading days. The 17th trading day, in most cases, falls within a day or two of Christmas. The table below parses data for the aggregated Decembers into three time frames; early, mid and late December to highlight the “sweet spot.”
Summary
This year, the 10th through 17th trading days are December 14th through the 26th. If 2018 plays out like the average of the past 28 years, there might be some extra goodies under the tree for those playing the Santa Rally. We caution, as shown earlier, that there have been Christmases where investors relying on the rally woke up to find coal in their portfolio stockings.
Twitter: @michaellebowitz
Any opinions expressed herein are solely those of the author, and do not in any way represent the views or opinions of any other person or entity.


