The Federal Reserve lowered the key interest rate by .25 last week. This is the second reduction in the past 2 months (the first was a .50 cut).
During this time, bond yields (interest rates) have risen sharply. What?!?
That said, it may be time for interest rates to finally follow the FED lower… if today’s chart follows history.
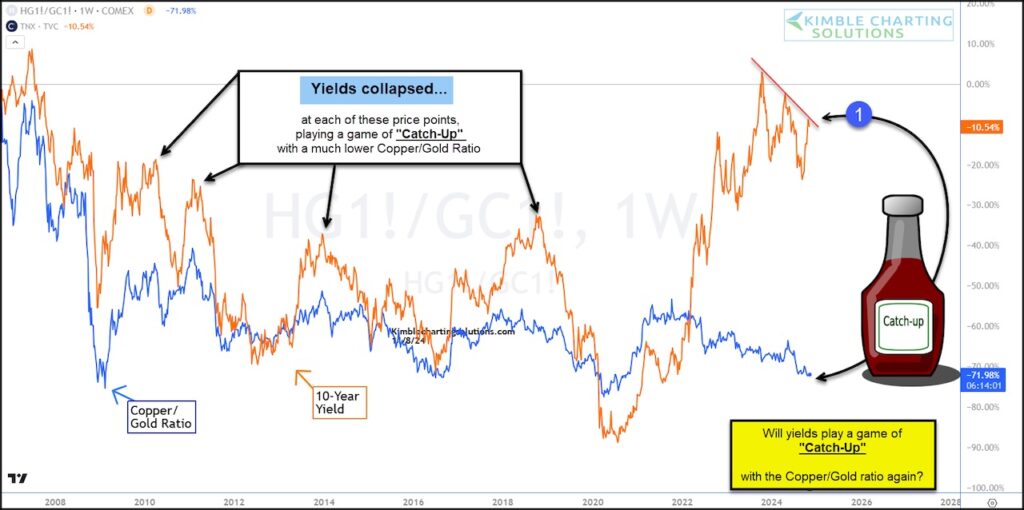
Today we look at a historical chart of 10-Year treasury bond yield versus the Copper/Gold ratio. Historically, these have had a high correlation.
However, during time of divergence, it’s been an indicator that mean reversion is coming.
Looking at the chart below, we can see that bond yields are WAY higher than the Copper/Gold ratio. And yields (interest rates) are testing falling resistance at (1).
Look back at history, interest rates tend to fall every time they get too far ahead of the Copper/Gold ratio. If history repeats, rates should fall a long way!
On the other side, a breakout at (1) would be bad for bonds as rates would surge and bonds fall.
This is inflection point city! Stay tuned!
Treasury Bond Yields vs Copper/Gold Ratio Chart

Twitter: @KimbleCharting
The author may have a position in mentioned securities. Any opinions expressed herein are solely those of the author, and do not in any way represent the views or opinions of any other person or entity.


