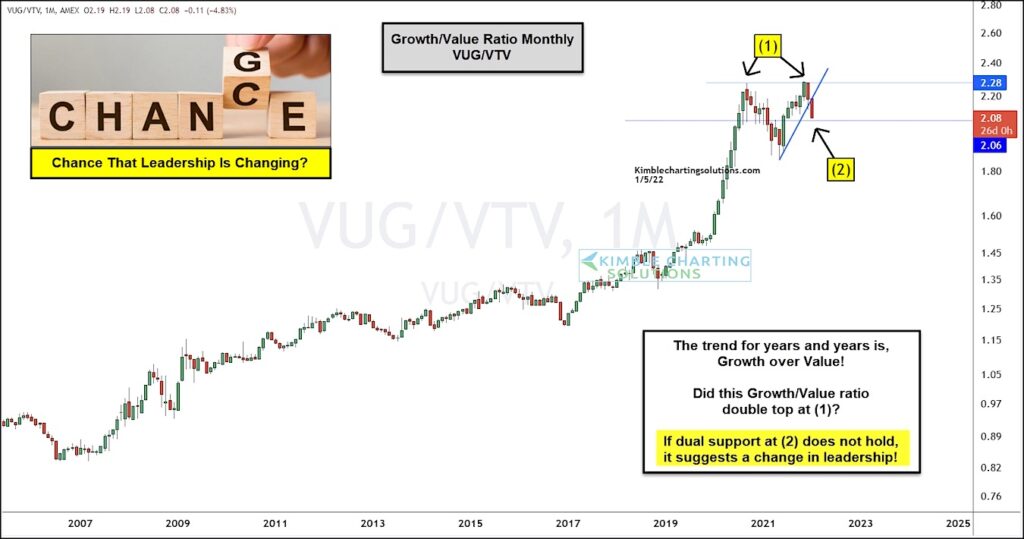
Growth stocks have out-performed value stocks for nearly 15 years, with a major surge from 2017 to 2020.
But the past two years have seen this turn into more of a tug-o-war as value stocks attempt to regain long lost favor.
Is a reversal of fortune underway?
It appears that way. Growth stocks leadership is waning and today’s chart highlights this. Below is a “monthly” performance ratio chart of the Growth Stocks ETF (VUG) versus the Value Stocks ETF (VTV). As you can see, the ratio double topped at (1) while breaking short-term trend support.
Yikes! And it is now testing support at (2). If this support fails to hold, it will suggest that a change of leadership is underway. Time for value stocks to shine? Stay tuned!
Growth Stocks ETF (VUG) / Value Stocks ETF (VTV) Ratio Chart

Note that KimbleCharting is offering a 2 week Free trial to See It Market readers. Just send me an email to services@kimblechartingsolutions.com for details to get set up.
Twitter: @KimbleCharting
Any opinions expressed herein are solely those of the author, and do not in any way represent the views or opinions of any other person or entity.


