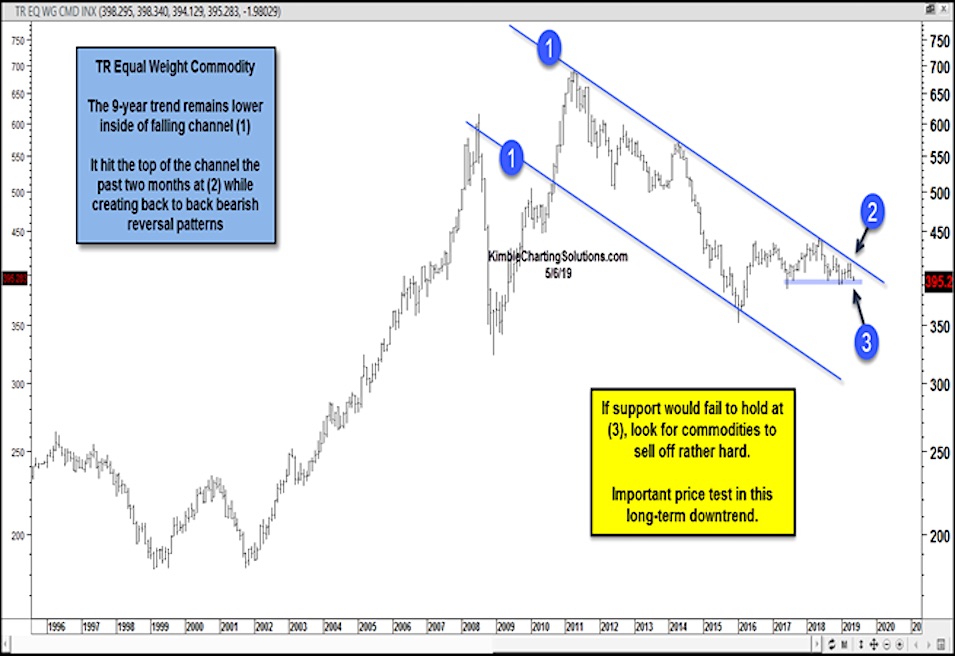
The commodity complex has been caught in a decline for the past several years.
Now that doesn’t mean that there haven’t been trading opportunities in select commodities during that time.
However, when indexes like the Thomson Reuters Equal Weight Commodity Index have been in a bear market for nearly a decade, it means that traders need to pick their spots (and timeframes).
In today’s chart, we look at the state of the current down trend (1) on the TR Equal Weight Commodity Index.
As you can see, this broad commodities index is testing both support and resistance at the same time. Price is being squeezed by a wedge pattern made up of 2 year lateral support (3) and the downtrend resistance line (2).
To break out of this 9 year falling channel, the commodities index would need to rally past (2). However, should support at (3) break, it would likely mean another sell off in the index (and commodities prices).
This is an important juncture for commodities. Stay tuned!
Equal Weight Commodity Index Chart

Note that KimbleCharting is offering a 2 week Free trial to See It Market readers. Just send me an email to services@kimblechartingsolutions.com for details to get set up.
Twitter: @KimbleCharting
Any opinions expressed herein are solely those of the author, and do not in any way represent the views or opinions of any other person or entity.


