The Case, Shiller 20-city House Price Index, is up 19.1% year over year. The only period with a somewhat comparable increase was in 2005 when it rose 14.9%.
Per Apartment List’s August update: Since January 2021, the national median rent has increased by a staggering 13.8 percent.
With a 30% contribution to CPI, Shelter prices are prone to boost CPI higher in the months ahead.
It seems like a logical conclusion, but is it?
The answer has tremendous implications for investors. If inflation continues to rise from elevated levels, the Fed will be under increasing internal and external pressure to taper QE and raise interest rates. For a market “all ginned up” on Fed liquidity, that is the last thing investors want to see.
So, let’s explore our question and try to answer it.
Consumer Price Index (CPI)- Shelter
The Bureau of Labor Statistics (BLS) category of Shelter, accounting for 30% of the CPI Index, is broken down into Owners’ Equivalent Rent (OER) at 23% and Rent of Primary Residency at 7%.
Unbeknownst to most people, the BLS only uses rent and rent proxies to calculate CPI. Such is because they believe the prices of houses and other residential structures are financial assets, not consumption items.
Agree or not, that is how they do it.
To calculate OER, the BLS uses the following survey question:
- “If someone were to rent your home today, how much do you think it
would rent for monthly, unfurnished and without utilities?”
To calculate rent, they use the following question:
- “What is the rental charge to your [household] for this unit including any
extra charges for garage and parking facilities? Do not include direct
payments by local, state or federal agencies. What period of time does this
cover?”
Finally, OER asks homeowners a hypothetical question starting with the word “if.”
Do you know what your home is worth? Do you know how much you can rent it for? Most homeowners have a much better idea of what their house is worth than how much they can rent it for.
Given 23% of CPI is based on a guesstimate of homeowners, does OER have much value in estimating rental prices? In all fairness, the BLS uses data checks and adjustments to improve survey results.
Click HERE for the BLS explanation on how they compute OER and Rent.
OER Is Not Forecastable?
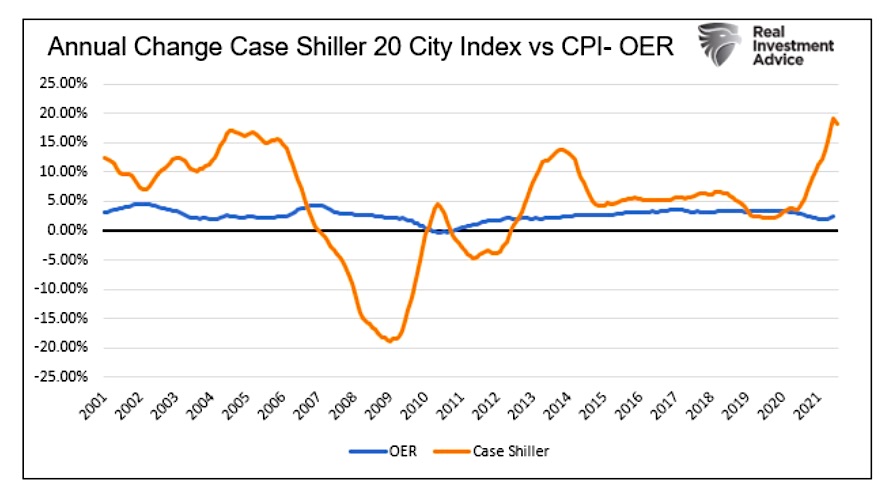
Since 2001, the Case Shiller Home Price Index has been volatile. At the same time, OER has been incredibly stable. From a statistical perspective, Case Shiller is over eight times more volatile than OER. Further, the two data sets have a near-zero correlation with each other.

As I wrote earlier, the BLS does not consider home prices in CPI. However, home prices are a vital component of rent. In addition, most homes get rented with the intent of the homeowner turning a profit. In other words, the homeowner aims to earn more than their maintenance, taxes, and mortgage payments.
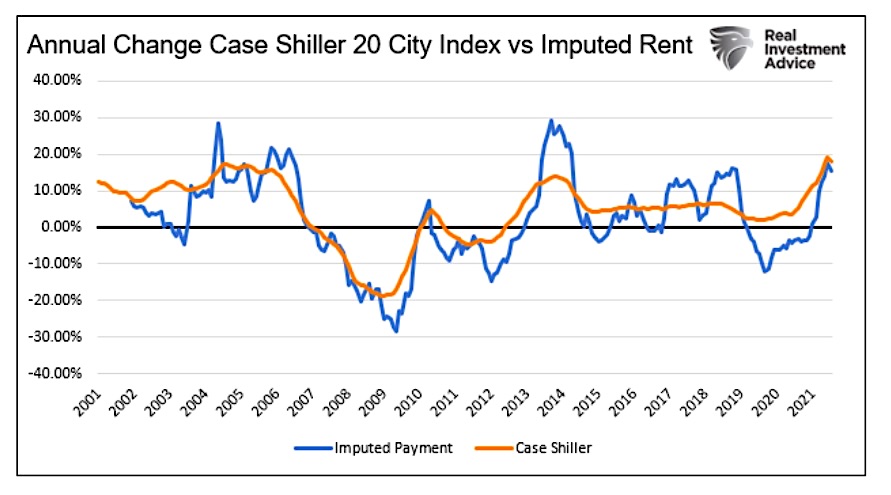
The following graph shows imputed mortgage payments based on historical mortgage rates and the Case Shiller price index. Imputed mortgage payments should serve as a strong proxy for rental prices despite not including homeowner maintenance and taxes.

Imputed mortgage payments are more volatile than Case Shiller due to constantly changing mortgage rates. However, the critical point is that this simple measure of home rental costs strongly compares with home prices.
Given OER does not correlate with home prices or imputed rental prices, we have zero ability to forecast 23% of CPI accurately. As such, we have no idea if soaring home prices will affect CPI.
CPI Rent
Rental prices, contributing 7% to the CPI Index, should be much easier to forecast. The rent survey question is not hypothetical like OER. They directly ask renters how much they pay in rent. In theory, this should provide a good measure of rental prices.
Unfortunately, theory and reality are not always the same.
Zillow puts out a rent index called the Zillow Rent Index (ZRI). Their index uses actual rental prices and Zestimates, or estimates of rental prices on properties not for rent.
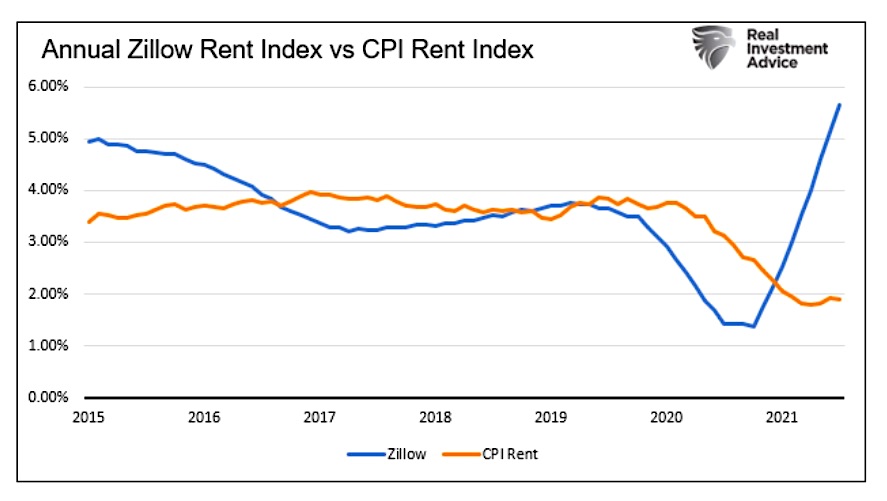
The graph below compares the BLS Rent index with Zillow’s ZRI.

The correlation is not zero, as with OER and Case Shiller, but it is far from statistically significant at .10
Like OER, the BLS measure of rent prices fails to represent the actual state of rental prices. Rent, like OER, is nearly impossible to forecast.
Summary
I started the article by sharing home price and rent data and asking if sharply rising Shelter prices will push CPI higher in the months ahead. I presume most readers answered with a resounding “YES.”
Now, understanding how the BLS formulates Shelter prices, I bet most of you are shrugging with confusion.
It appears impossible to calculate the BLS version of OER or rent.
Those, like the Fed betting on transitory inflation, should be careful. If either OER or Rental prices show some correlation to reality, CPI could not only continue to run hot but could rise from elevated levels. That said, looking at historical BLS data, it appears Shelter prices will not change markedly from current levels.
Twitter: @michaellebowitz
The author or his firm may have positions in mentioned securities at the time of publication. Any opinions expressed herein are solely those of the author, and do not in any way represent the views or opinions of any other person or entity.


