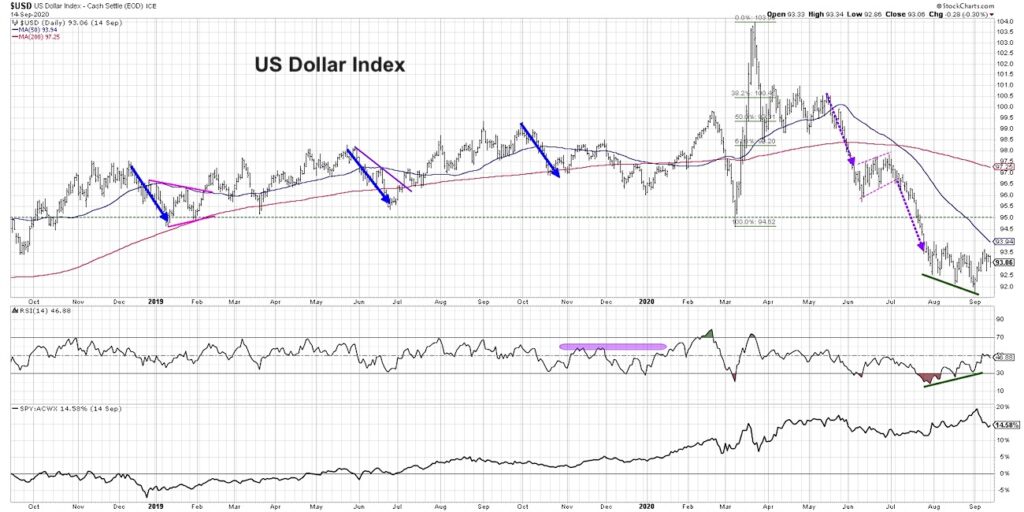
One of the key investment themes of 2020 has been the rotation from a stronger US Dollar environment to a weaker Dollar through mid-September. However, signs are emerging that the downtrend in the greenback may be nearing its end, which will have implications for equities through year end.
The two-year chart of the US Dollar currency index beautifully illustrates the stronger Dollar environment through much of 2019, as regular pullbacks quickly resolve back to the upside.
If you consider the February to March period as a “dislocation period” where most assets were going through a major shift, you can then recognize how the first six months of 2020 have basically seen a general rotation from a stronger to weaker Dollar.
Now we’re seeing a bullish divergence between price and RSI, where the price is making lower lows and the RSI is making higher lows over the same time period. This speaks to a lessening of downside momentum and often coincides with market bottoming patterns.
Long story short, we’re seeing the signs of a potential rotation back to a stronger Dollar environment. For me, a bullish divergence is what puts a chart like this on my watch list, as it is starting to indicate a potential for a bottom.
Most important is price, so if we see a rotation to higher highs and higher lows for $USD, then this would confirm a bottom has most likely completed.

What does that mean for other asset classes?
Conventional wisdom would tell you that a stronger dollar means US stocks are outperforming global stocks, as well as small caps outperforming large caps. These have to do with the implications of a stronger dollar for mega-cap multinationals who are more sensitive to shifts in the dollar.
The bottom panel on today’s chart shows the relative performance of the S&P 500 versus the All-Country World ex-US index. To put another way, we’re looking at the US versus the rest of the world.
You may notice that the US has been outperforming global stocks fairly consistently for the last two years. This speaks to the leadership of US mega-cap stocks specifically in the Technology, Communication Services, and Consumer Discretionary sectors.
What’s interesting is that over the last six months, US stocks have continued to outperform. There was a notable stretch after the June market peak where this ratio took a significant turn lower, but the ratio resolved to the upside as US stocks made a new relative high again in early September.
While a stronger dollar tends to have implications for equities, I would caution investors from drawing simplistic relationships between any two asset classes. A stronger dollar suggests a tailwind for outperformance of US stocks, as well as small caps over large caps. But the most important piece of information to analyze in any of those asset classes is the price of the asset itself!
To see this article in video format, check out Dave’s YouTube channel!
Twitter: @DKellerCMT
The author may have a position in mentioned securities at the time of publication. Any opinions expressed herein are solely those of the author, and do not in any way represent the views or opinions of any other person or entity.


