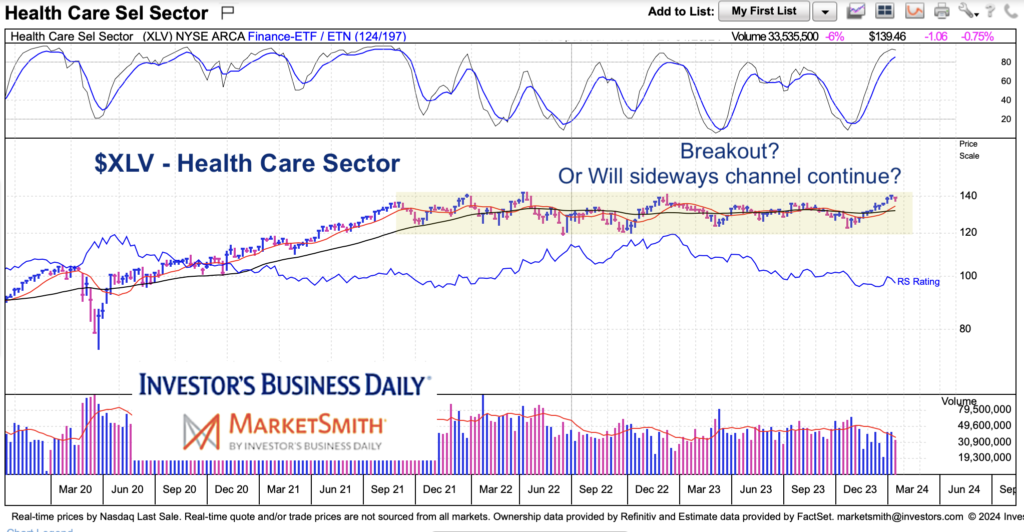
After a big Covid run-up, the Health Care Sector ETF (XLV) has traded in a 30 month sideways channel.
But with the stock market trading at new highs XLV is also threatening to break out to new highs.
Bulls want to see as many sector breakouts as possible so add this one to your radar.
Note that the following MarketSmith charts are built with Investors Business Daily’s product suite.
I am an Investors Business Daily (IBD) partner and promote the use of their products. The entire platform offers a good mix of tools, education, and technical and fundamental data.
$XLV Health Care Sector ETF “weekly” Chart
Sideways channels create strong support and resistance. So when an asset breaks out of the channel it often leads to a meaningful move. Time to add XLV to your breakout watch list.
If resistance holds, watch how price holds up relative to momentum. A sharp drop in momentum with price declining through the 10/40 week moving averages would be negative.

Twitter: @andrewnyquist
The author may have a position in mentioned securities at the time of publication. Any opinions expressed herein are solely those of the author, and do not in any way represent the views or opinions of any other person or entity.


