As the stock market trades near all-time highs, not all sectors are joining the party.
In total, it’s a mixed bag. Some are bullish, some are sideways, and some are bearish.
Today, we look within that mixed bag to highlight a sector that is near all-time highs… but has been for nearly 5 months! It’s the Health Care Sector ETF (XLV).
Lot’s of consolidation across the markets. Perhaps the next leg of the bull market (if it happens) will be spurred by breakouts from sectors in consolidation.
Note that the following MarketSurge charts are built with Investors Business Daily’s product suite.
I am an Investors Business Daily (IBD) partner and promote the use of their products. The entire platform offers a good mix of tools, education, and technical and fundamental data.
$XLV Health Care Sector ETF Chart
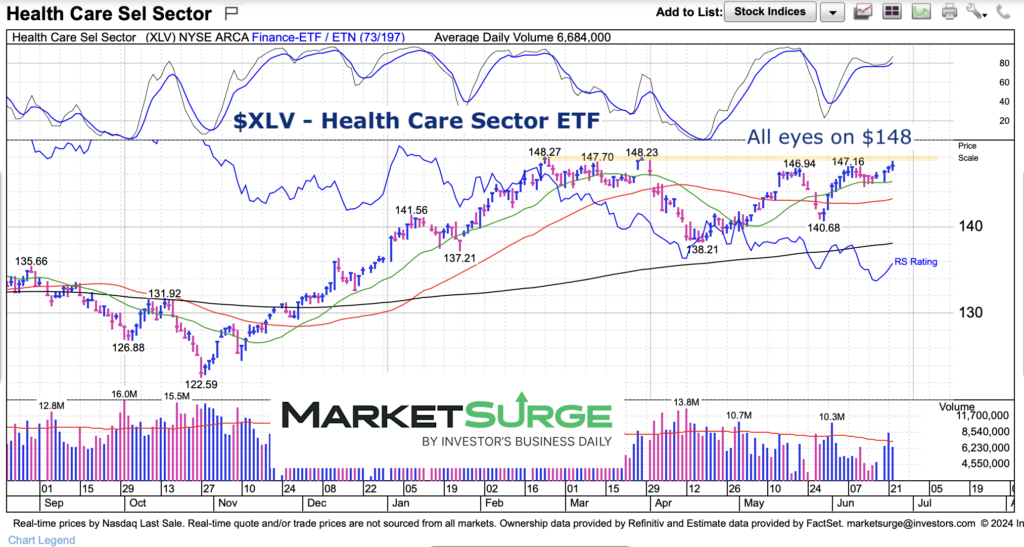
This chart kind of fits my M.O. — A simple chart that speaks for itself. Price is currently above all major moving averages. And a breakout over $148 (clear resistance) and bulls are hiking higher again.
HOWEVER, there is an RSI and momentum divergence. This is worth noting as it could hamstring any breakout attempt.

Twitter: @andrewnyquist
The author may have a position in mentioned securities at the time of publication. Any opinions expressed herein are solely those of the author, and do not in any way represent the views or opinions of any other person or entity.


