Rising interest rates are beginning to spook investors. And rightfully so.
It’s been the fastest rise in rates in decades. And just when we thought interest rates were easing, they pushed higher once more!
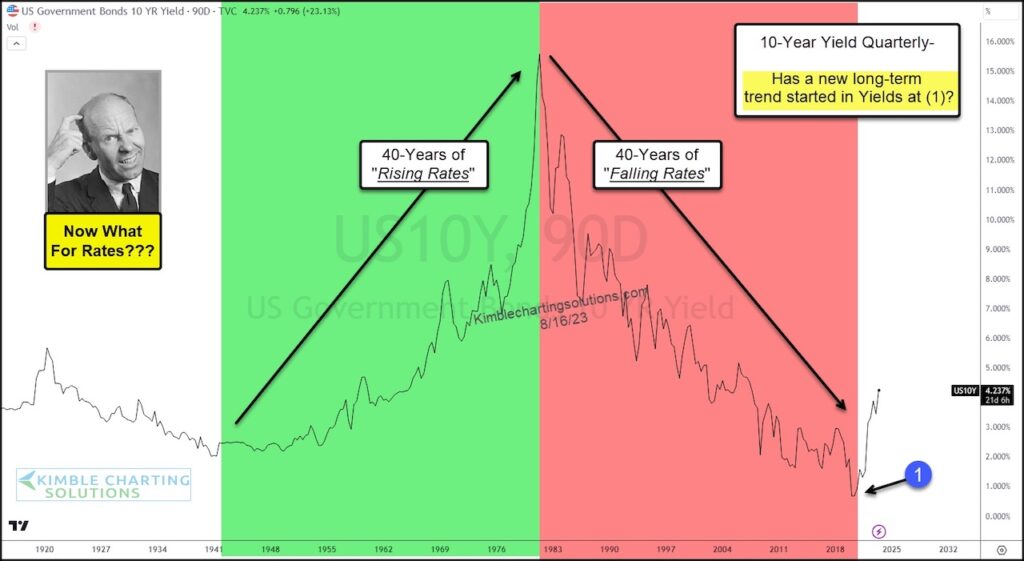
40 years up and then 40 years down… now what for bond yields?
As most investors know, consumer rates are often tied to the 10-year US treasury bond yield.
And when we look at today’s long-term “quarterly” chart, it appears yields are attempting a breakout amidst a broader trend change.
So while interest rates could pull back at any point over the coming weeks/months, we may need to adjust in a new market trend of higher rates. And this has investors and consumers feeling a bit uneasy. Stay tuned!
10-Year US Treasury Bond Yield “Quarterly” Chart

Note that KimbleCharting is offering a 2 week Free trial to See It Market readers. Just send me an email to services@kimblechartingsolutions.com for details to get set up.
Twitter: @KimbleCharting
Any opinions expressed herein are solely those of the author, and do not in any way represent the views or opinions of any other person or entity.


