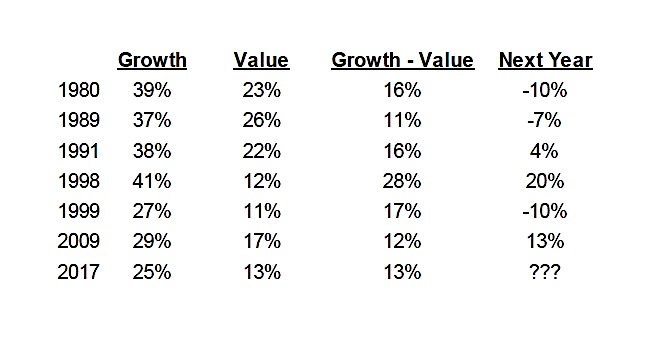
It should not be lost on investors that in 2017 the S&P 500 Growth Index outperformed the S&P 500 Value Index by 13% (+25.4% vs +12.6%). These two style indices essentially break down the S&P 500 constituents based on either having value or growth characteristics.
As an example, the price-to-earnings for the Growth index is currently 21.4x while Value is a cheaper 16.3x. Price-to-book for Growth is 3.8x while Value is 1.7x. Year 2017 clearly went the way of Growth, rising 25.4% compared to the total S&P 500 index price return of 19.4%. Value rose a respectable 12.6%, but clearly trailed.
A 13% positive performance spread for Growth over Value is the highest we have since 1999. That reference should be noted by investors as it was the final year of the bull market run of the 1990s and was followed by three consecutive down years for the S&P 500. We took a look back to the early 1970s to see how the broader market faired following years that experienced a strong relative outperformance of Growth over Value (table). After 1980 and 1989, it did not bode well for equities in general. Following 1991, performance was positive in 1992, but rather subdued at 4%. Year 1998 saw growth stocks fly and that carried into a great market in 1999, but then ended poorly in 2000- 02 (-10%, -13%, -23%). In 2009, growth rebounded more strongly than Value after the financial crisis, but this may be partly due to financials having a bigger weighting in the Value index and that sector continued to lag.
So what does this mean for 2018? It really comes down to whether you believe last year was similar to 1998 in which case there is more room for the market to run. Otherwise, the data certainly points to a more subdued outlook. Our Market Cycle data continues to favour a continuation of the bull market but there are more and more signs of an aging bull. Growth crushing value in 2017 is certainly another data point.
Why does Growth typically outperform late in a market cycle?
Putting the table data aside, it is intuitive for growth to outperform late in the cycle. Usually late in the cycle economic data is improving, earnings growth is surprising to the upside and this likely provides more of a lift for growth stocks over value. Conversely in most flat or falling markets value tends to hold up better, usually because they are already cheap which limits the downside.
Your Investment Style may be determined by when you were born
All of us, humans that is, like to believe we make choices and that determines our path through life. While this may be a partial truth, there are other factors beyond our control that arguably have an even bigger impact on our lives. Did we meet and become friends with a good mentor at an early age to help guide decisions? Did you luck out on where you live? As a young lad working for one of our banks brokerage firms in the mid-1990s in Vancouver, I realized if portfolio management was my desired path it would require me to pack up and head to another city. Vancouver has grown up a lot over the past few decades but back in the 1990s options were limited (Still miss that town!).
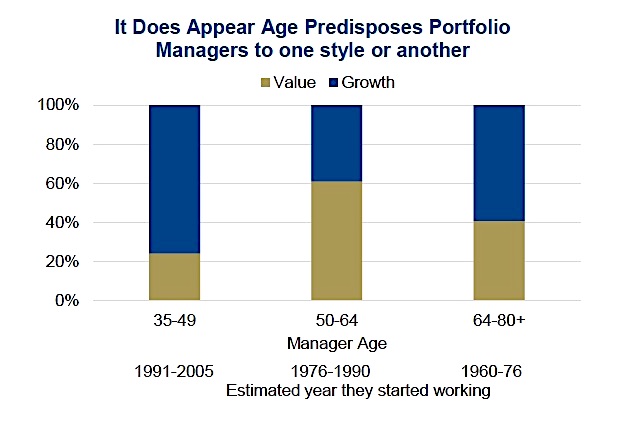
Bringing this back to investment style, we have found some interesting data on your age as a function of your investment style. We analyzed a large sample of U.S. funds that are either classified as Growth or Value and did some internet sleuthing to determine the portfolio managers age. We used U.S. funds, as style is somewhat lost in Canada given our market composition. Most in Canada lean towards value and dividend yield while growth tends to be very small cap. The U.S. has a much more diverse market when it comes to style investing.
For portfolio managers under 50 years of age, we found the vast majority were Growth managers. Managers over 64 tended to be Growth managers as well. That left most of the Value managers in the age cohort of 50-64. This may not be as crazy as it sounds. Growth investing was the outperforming strategy in the late 1960s until 1973 as the Nifty 50 stocks were dominating.
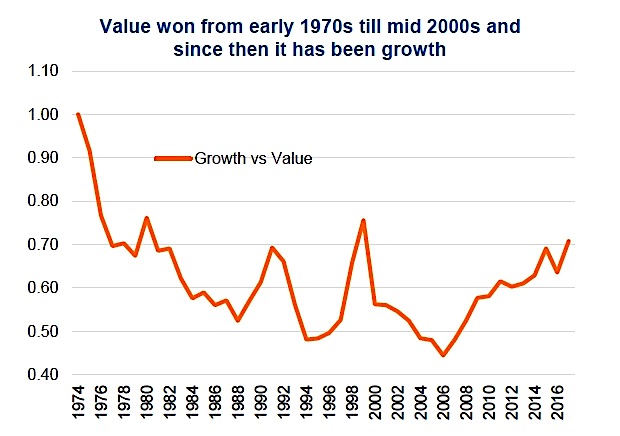
These were the companies that appeared to be poised to take over the world thanks to technology or other advantages. You know, names like Xerox, IBM, Eastman-Kodak and Kmart. Otherwise known as the Apple, Amazon and Facebook of the late 1960s and early 1970s. A young person entering finance during or at the end of this growth cycle would be more likely to be mentored and learn under a growth manager due to their recent success. As a result they became Growth managers for their careers. Then during the 1974 to early 1990s, Value managers were dominating (chart above – falling line denotes Value outperforming Growth). Entering the workforce during this time period there was a greater chance of becoming a Value manager. More recently, the youngest cohort entered as Growth was coming back into vogue and more became Growth managers (or momentum).
Not surprising the dominant strategy when you first start to become an investor has an impact on how you will approach investing for the long term. This is unfortunate but also understandable. Investors learning to invest in today’s environment could likely jump to the conclusion that Growth/Momentum is the way to go. Or even that passive is the way to go. Yet this narrow view can be countered by studying investment history. Remember the market is cyclical, what works today will likely give way to other approaches in the future. The key is to remain diversified and not become married to any one style.
Charts are sourced to Bloomberg unless otherwise noted.
Twitter: @ConnectedWealth
Any opinions expressed herein are solely those of the authors, and do not in any way represent the views or opinions of any other person or entity.


