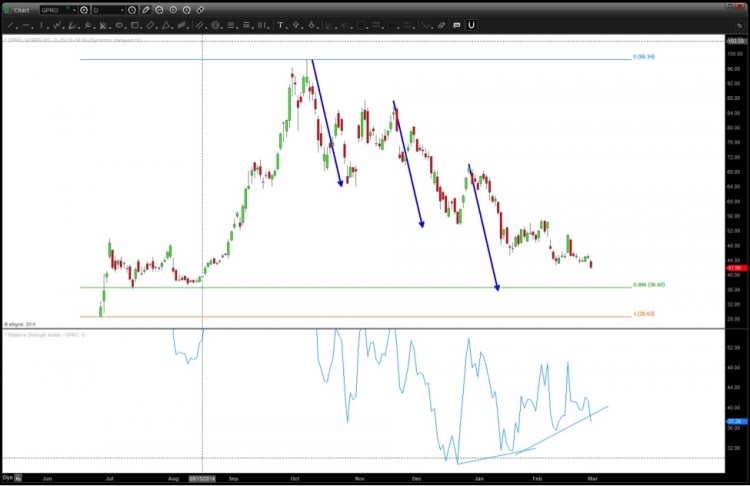
GoPro’s stock (GPRO) has definitely been taking it on the chin of late. Each bounce has been sold as investors have slowly deflated the IPO euphoria from the stock. The pullback off the highs wasn’t a surprise – I called the top in October – but depth of the pullback has been a bit eye-opening. With the stock trading at around $40 per share, and well off its post-IPO highs, it’s once again time to take a look at the chart and attempt to highlight where GPRO technical support levels come into play.
Back in December, I noted an important GPRO technical support level around $53-$55. At the end of that post, I wrote:
IF GoPro is going to move higher, this zone of support needs to hold. If it doesn’t we might have seen the high on GPRO for some time.
As you can see in the chart below, that GPRO technical support level worked for a nice bounce, but in the end that’s all it was – just a bounce.
So where is GoPro’s stock now from a technical analysis viewpoint?
As you can see in the GoPro stock chart below, price is nearing an important technical support level (and price target) near $36. I like the $36 level on the charts for a variety of reasons: those include 5 waves lower, symmetry, lateral support, and an RSI divergence.
The key to the chart below is that all the moves lower (represented by the blue arrows) have been exactly the same. Also, take a look at the bullish divergence present on the 14 period RSI.
In short, the math is saying that GoPro’s stock could be setting up for a nice bounce. But, when playing a “bounce” on any stock, active investors must always remember to use a stop loss and follow a plan. I’ll try to update with more of my thoughts as the stock get closer to $36. Thanks for reading.
GoPro Stock Chart – GPRO Technical Support Level
Follow Bart on Twitter: @BartsCharts
No position in any of the mentioned securities at the time of publication. Any opinions expressed herein are solely those of the author, and do not in any way represent the views or opinions of any other person or entity.


