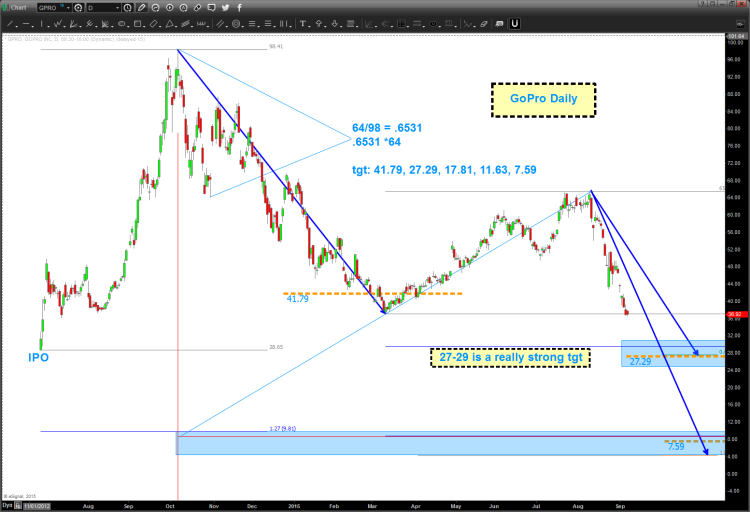
It’s been a bumpy ride for shares of GoPro (GPRO). Yet, when we take a step back and look at the price patterns, it’s clear that the swings have been very harmonic in nature for GoPro stock.
If you’ve been reading my posts on See It Market, you are likely aware that I have tracked and targeted GoPro’s price swings for the past year. Reading charts via advanced pattern recognition is my passion.
We’ve tracked the swings in GoPro stock pretty well. Below is a list of links to past articles and swing targets:
- October 2, 2014: Why GoPro Is Set For A Pullback. Herein, I highlighted $98 as the target. “Geometry tells us that 98 will be formidable resistance and that a pullback should occur in and around this area.”
- December 14, 2014: GoPro Stock Nearing Important Price Support. In this post we showed why $53 was an important support; the stock then bounced up to $68.
- March 2, 2015: GoPro Nearing Key Technical Support Level. After the move from $53 back up to $68, GoPro stock turned back down again … In this post, we pointed to $36 as a key price support area (the stock hit $37).
- June 5, 2015: GoPro Stock Update: GPRO At Technical Resistance. From $37 we projected back up into $60. GPRO went a bit higher into $64 before starting back down.
So, where are we now?
It certainly looks like the lows around $36/$37 are going to break to the downside. If/When this happens, we should roll into the $27-$29 area. That “should” be pretty strong support … if we lose that level, then look for a move all the way down into the single digits. click to enlarge chart
Thanks for reading.
Twitter: @BartsCharts
Author does not have a position in mentioned securities at the time of publication. Any opinions expressed herein are solely those of the author, and do not in any way represent the views or opinions of any other person or entity.


