I recall tweet replies of the unkind nature when I suggested that selling Goldman Sachs stock (GS) near $170/share (a hair above tangible book of $166/share) didn’t seem like a very good idea to me. Fast forward a few months and GS stock is almost $210, and printing a number of DeMark indicators that suggest it finally needs at least a rest.
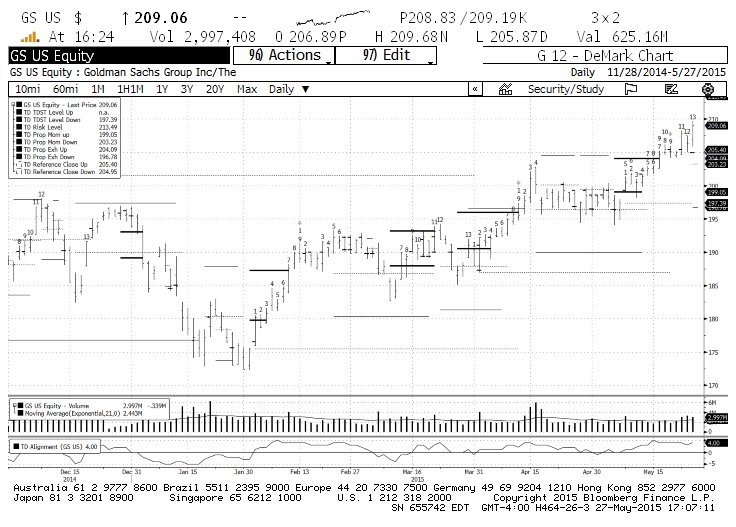
Yesterday Goldman Sachs stock chart printed a daily TD Sequential Countdown 13 Sell with the related “Risk Level” (i.e. secondary exhaustion area) at $213.49. TD Alignment – a mix of various overbought/oversold DeMark oscillators – is at a 4 out of a max of 5.
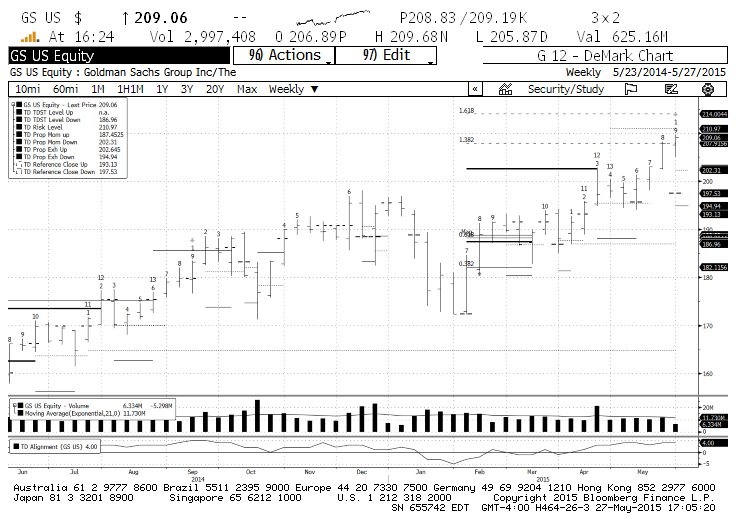
Looking at the weekly time frame, we see that it also has an active TD Sell Countdown 13 Sell signal and is very likely to print a fresh TD Sell Setup at the end of this week. “Risk Level” for the active Countdown Sell is at $213.49. The weekly chart also shows the next TD Relative Retracement Level at $214.00, and the prior one at $207.91 remains non-qualified. TD Alignment is also at 4.
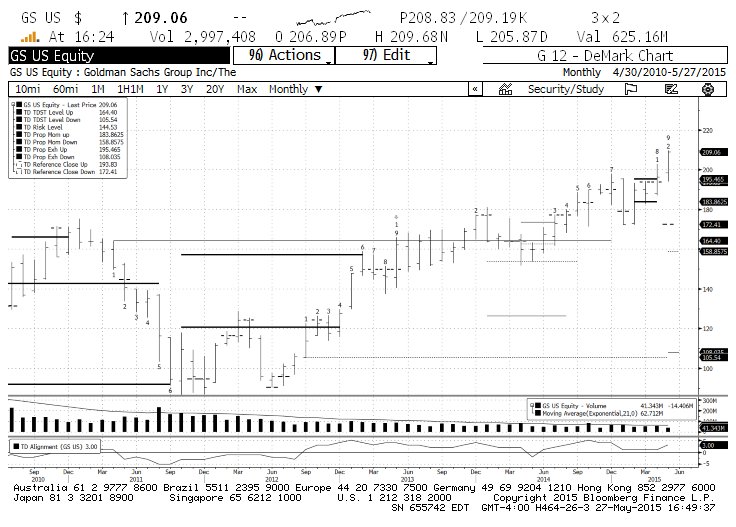
However, bulls can rest their arguments on the monthly chart. GS (and by extension the rest of the market??) looks like it has at least several more months of upside before it completes the monthly Countdown Sell suggested by the “qualified” break of TDST Level Up at $164.40.
So for the next few/several weeks it looks like there will be an opportunity to trade around a long position and/or sell calls for cash flow. But for the longer term, Goldman Sachs stock still shows as having plenty of gas in the tank.
Goldman Sachs Stock Chart – DAILY
Goldman Sachs Stock Chart – WEEKLY
Goldman Sachs Stock Chart – MONTHLY
Thanks for reading and happy trading.
Twitter: @FZucchi
The author has a position in GS at the time of publication. Any opinions expressed herein are solely those of the author, and do not in any way represent the views or opinions of any other person or entity.


