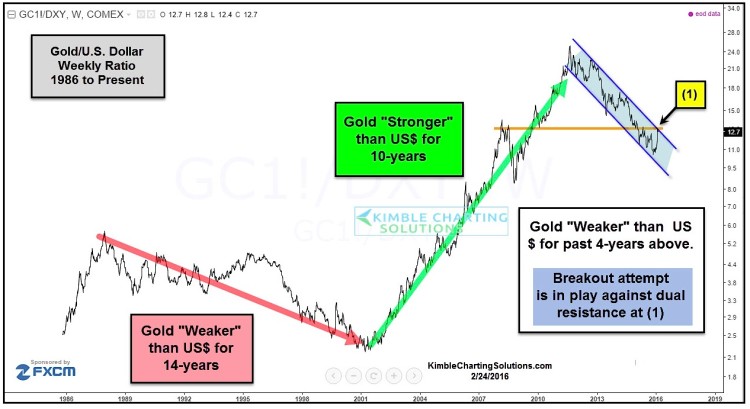
Over the last 30-years, a lot has happened in the battle between Gold prices and the US Dollar. As you can see in the chart below, a couple of long-term trends have taken place.
From the late 1980s to 2000 Gold was weaker than the US Dollar, forming lower highs and lower lows. However, precious metals were much stronger than Dollar into 2011.
Currently, a new multi-year trend of lower highs and lower lows is in play for Gold prices, as precious metals have been much weaker since topping in 2011.
So what gives? Why is now an important time to pay attention?
Well, Gold is up nearly 15 percent thus far in 2016. Gold hasn’t been able to put up such positive numbers in some time (especially after a prolonged period of consolidation). That said, precious metals are still in a bear market until proven otherwise. And the bear market rally that has taken place over the past 90-days has pushed its relative strength higher, but its still within a declining channel.
BUT, the ratio of Gold/US Dollar is testing key resistance at point (1), as multi-year declining channel resistance is in play. What happens next may be important.
What Gold prices and the US Dollar Index do at falling resistance could change the way the markets behave over the coming years (while deciding if precious metal stay in the dog house or reverse trend and gain more attention).
How this shakes out should also provide insights into where global markets and economies are headed next.
Stay tuned and thanks for reading.
Read more from Chris: “This Stock Market Correction Is Wringing Out The Bulls“
Twitter: @KimbleCharting
The author does not have a position in the mentioned security at the time of publication. Any opinions expressed herein are solely those of the author, and do not in any way represent the views or opinions of any other person or entity.


