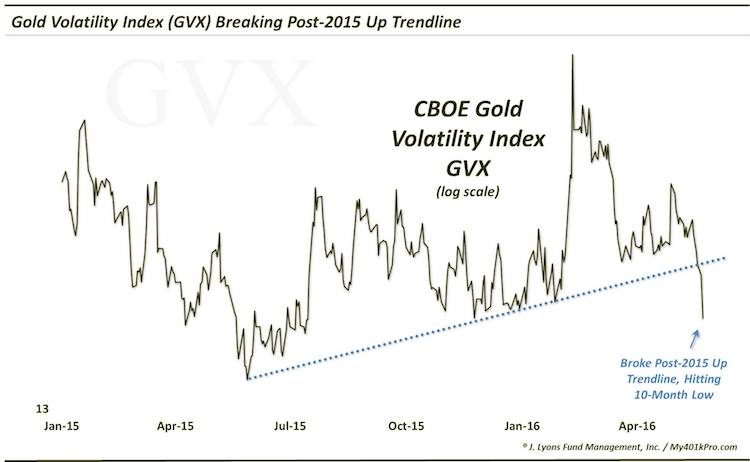
After a big run higher in the first half of 2016 that saw gold prices press over $1300 in early May, the yellow metal is taking a breather. The past two weeks have seen gold prices drop over 6 percent. Logic here would suggest that gold volatility is rising.
But if you follow the CBOE Gold Volatility Index (GVX), you already know that’s not the case.
Here are some bullet points about the GVX, what the chart below is saying, and what may come next for Gold:
- The CBOE Gold Volatility Index (GVX) broke below its 12-month Up trendline this week (using a logarithmic scale), finishing at 10-month lows.
- In our experience, unlike equity volatility indices which tend to rise in sympathy with equity declines, commodity volatility indices tend to be truer indications of volatility expectations, regardless of the direction of the underlying — thus, the drop in the GVX this week, despite the weakness in gold.
- This breakdown suggests a lower volatility regime ahead for the yellow metal, with (perhaps) a developing upward bias over the intermediate-term.
Gold Volatility Index (GVX)
Thanks for reading.
More from Dana: ISE Equity Call/Put Ratio Prints Unusual Reading
Twitter: @JLyonsFundMgmt
Any opinions expressed herein are solely those of the author, and do not in any way represent the views or opinions of any other person or entity.


