The price of Gold has been moving steadily higher over the past year, making new all-time highs. It’s currently trading over $2500!
And we have been forecasting and discussing this for the past two years. Read more here.
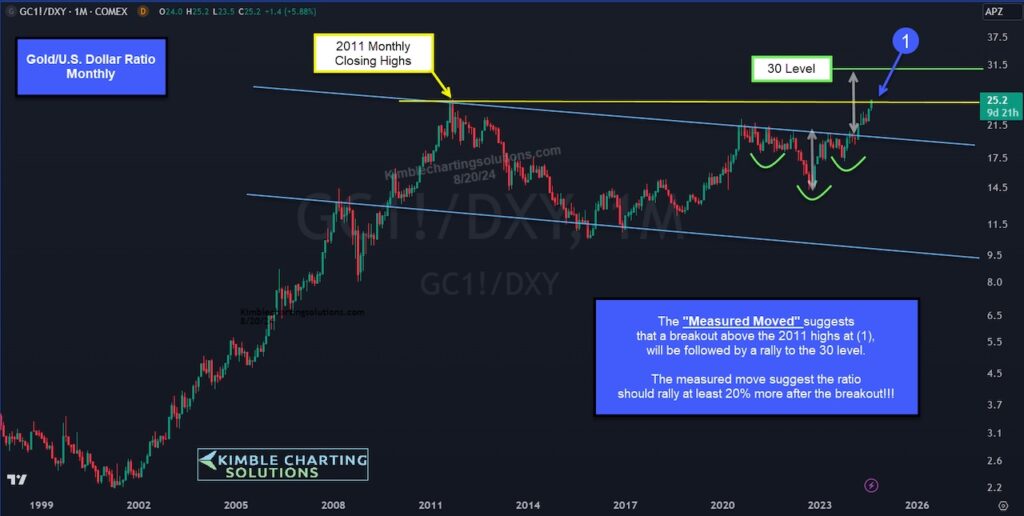
Today, we look at an important Gold price ratio — The Gold to US Dollar Ratio on a long-term “monthly” bar chart.
As you can see, the Gold/Dollar ratio is testing the 2011 high for the first time in history. And using the inverse head and shoulders breakout as our guide, we can project a measured move to the 30+ level… IF gold continues to breakout above (1).
With political uncertainty and war abroad, Gold could continue to shine. Stay tuned!
Gold / US Dollar “monthly” Price Ratio Chart
Note that KimbleCharting is offering a 2 week Free trial to See It Market readers. Just send me an email to services@kimblechartingsolutions.com for details to get set up.
Twitter: @KimbleCharting
The author may have a position in mentioned securities. Any opinions expressed herein are solely those of the author, and do not in any way represent the views or opinions of any other person or entity.

 Pressuring Lower Price Support")

