The trading setup for gold is very interesting here.
At this point, there are a lot of “ifs” for this trade working out.
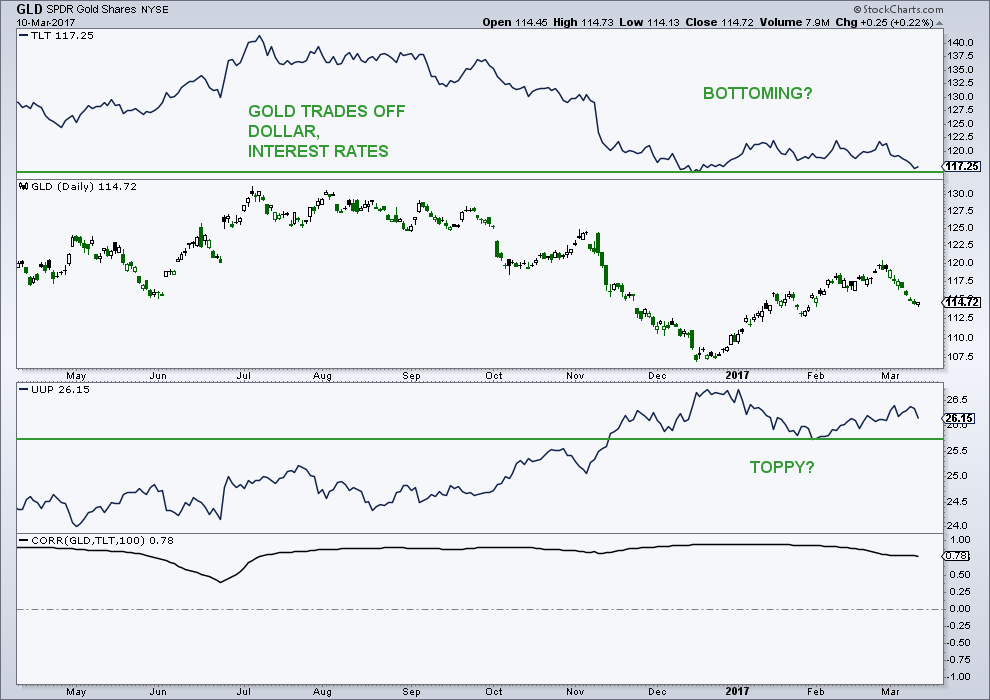
The COT data for gold is only slightly bullish. Yet intermarket analysis looks promising: If yields are topping here (bond prices bottoming), and the US dollar rolls over from a toppy looking patten, Gold prices could reverse hard to the upside in the not to distant future.
Here’s a chart of the Gold (NYSEARCA:GLD), the US Dollar (NYSEARCA:UUP), and 20+ year treasury bond (NASDAQ:TLT).
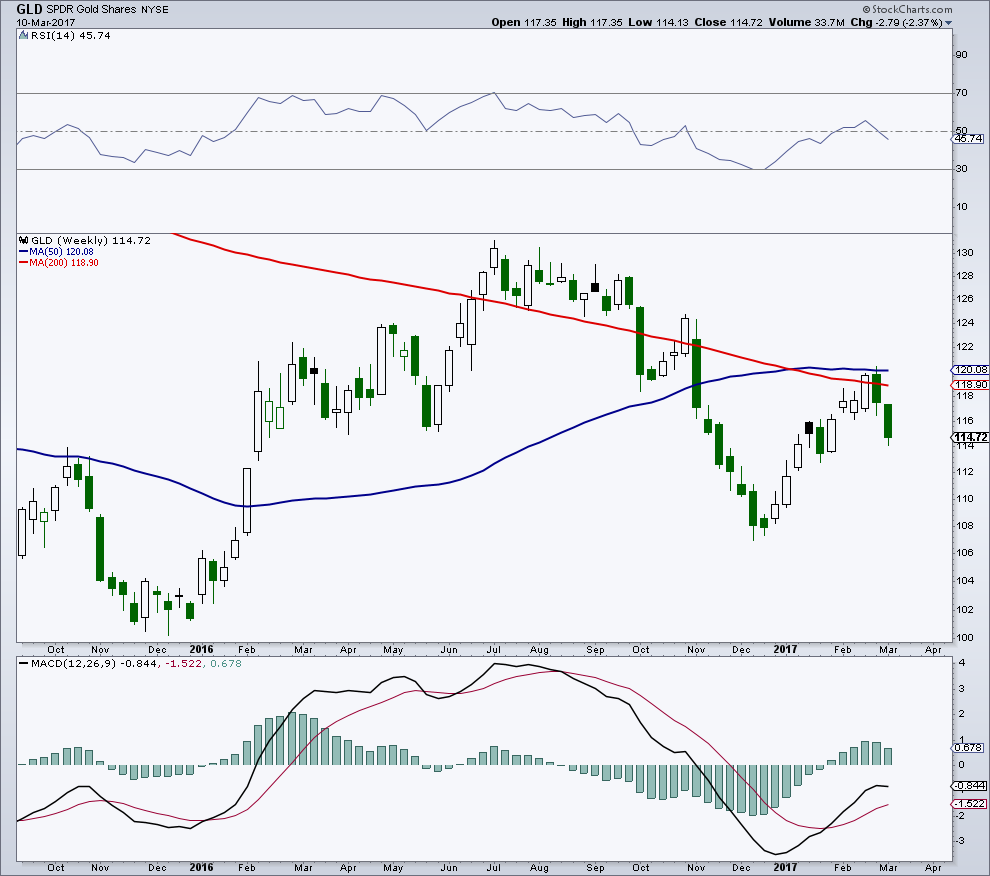
More if’s: If the rally from December 2015 to July 2016 was the first wave higher (Wave 1) in a new bull market, and the recent pullback from July 2016 until December 2016 was Wave 2 (counter), its possible that the rally from December 2016 to February 2017 was minor wave 1 and that the current pullback is minor wave 2. This sets up the possibility that Major wave 3 of 3 could start at any time.
From an Elliott Wave perspective, this is where you see the meat of a bull market for most financial assets.
At this point, this is a risky trade, but if I’m correct, there will be plenty of opportunities to enter this market when we get more confirmation. Note that I recently took a small trading position in GDXJ.
Thanks for reading. Reach out to me at arbetermark@gmail.com for inquiries about my newsletter “On The Mark”, if interested.
Twitter: @MarkArbeter
Any opinions expressed herein are solely those of the author, and do not in any way represent the views or opinions of any other person or entity.


