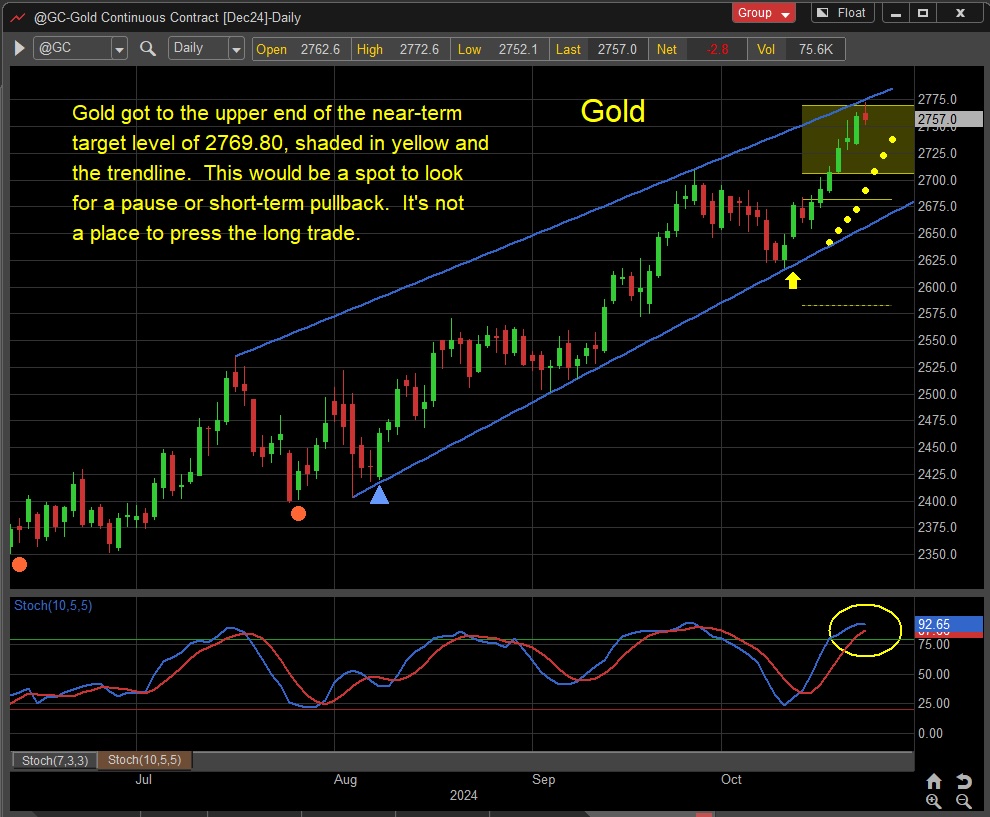
Gold continues to show strength in October. In fact, gold has been strong all year.
Much of the strength in gold and precious metals comes on the heels of a massive breakout to new all-time highs for gold.
Looking at the price chart below for gold futures, we can see that gold has rallied to the upper end of its price channel and near-term target area of 2725 to 2775. It’s also getting overbought, so it’s a good idea to watch the stochastics closely for a potential downward crossover.
This looks like a good spot to look for a pause or short-term pullback.
Gold Futures Price Chart

Check out my research offerings on Cerundolo Investment Research.
Twitter: @GuyCerundolo
The author or his firm have a position in mentioned securities at the time of publication. Any opinions expressed herein are solely those of the author, and do not in any way represent the views or opinions of any other person or entity.


