 After hitting 4 year lows, the recent Gold rally has brought the yellow metal back to $1200/oz. That’s the good news. The bad news is that Gold failed to rally during September (a seasonally strong month) and is now trading in no man’s land. And with a stronger US Dollar and deflation in the air, it’s quite possible that the yellow metal will visit this level sometime over the coming months. But depending on who you ask, investors responses about Gold will vary widely. Some investors believe it will hit $1000 by year end, some think $1000 by next year, while others say this won’t happen and it will hit $2000 next year.
That said, it’s noticeable that Gold bulls are softening up a bit. That will happen when an asset drops from over $1900 to below $1200 in just over 3 years time. And I say that with all due respect for Gold. I think Gold is good longer-term portfolio buy under $1200… and an even better longer-term buy under $1000. But I’m an active investor and my time frames tend to be shorter than the average investor, so I’ll do my best to mix in a little bit of both views. Note that a popular vehicle for investing in and tracking Gold is the ETF, SPDR Gold Shares (GLD – Quote).
Although I did point out the possibility of Gold hitting $1000 when it was trading near $1600, I really don’t care that much about landmark targets. I’m really just concerned with time & price. And currently Gold is in an interesting situation from a technical and seasonal standpoint. And the recent Gold rally only makes it more difficult to diagnose over the near-to-intermediate term.
Okay, let’s walk through a couple of price charts and take a look at some seasonal trends to gauge the current state of Gold heading into year-end.
Technical Perspective – Neutral to Bearish
At under $1200/oz, Gold has yet to neutralize the recent downtrend since last summer. However, it has rallied over $50 in the past month and sentiment isn’t nearly as bullish as it was even 6 months ago. This could allow for a bit more upside… but since the Gold rally has yet to develop in a material way, we have to work with what’s in front of us.
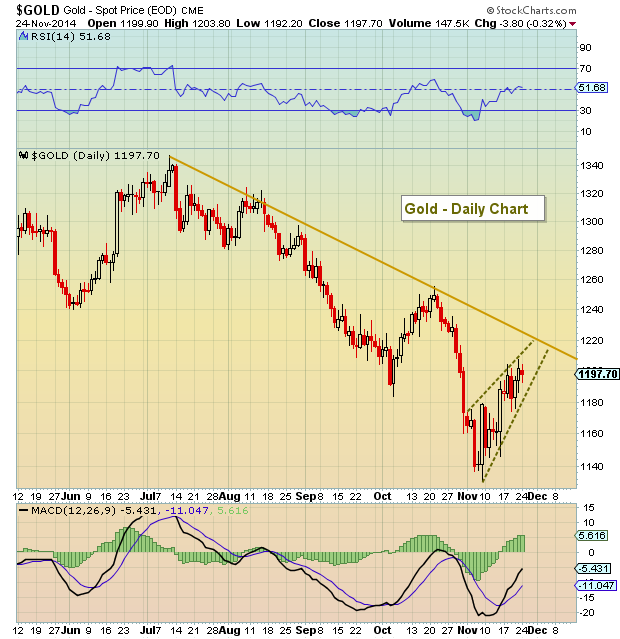
On the daily chart below, you can see that the Gold rally has formed a rising wedge (bearish) on the daily chart. A break below the lower trend line could retest the lows. Even if Gold continues higher, it will meet downtrend resistance around $1220. Only a break above $1220 will neutralize Gold.
Gold Rally – Bearish Wedge On Daily Chart?
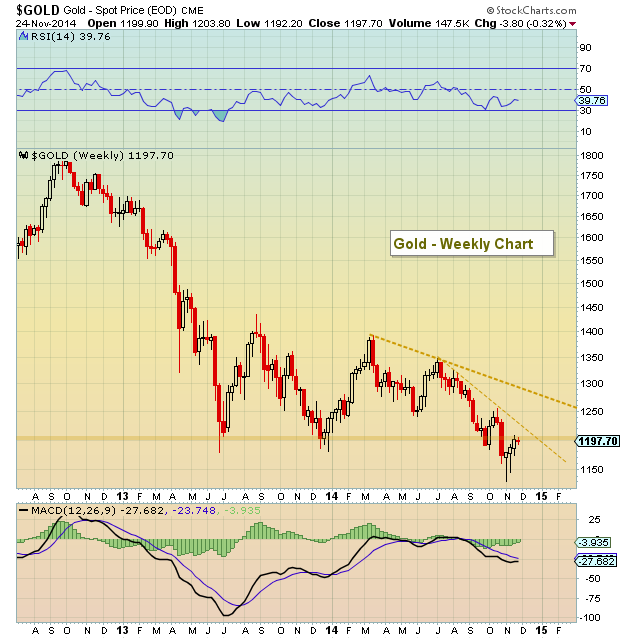
Here’s another look at Gold on a weekly chart. This more macro perspective shows the importance of the $1200 level and the downtrend line around $1220. If Gold rises above $1220, then the October highs around $1250 come into play. In my opinion, if this Gold rally has legs, it will need to break above the October highs.
Gold Weekly Chart
Seasonal Perspective – Bullish… or is it?
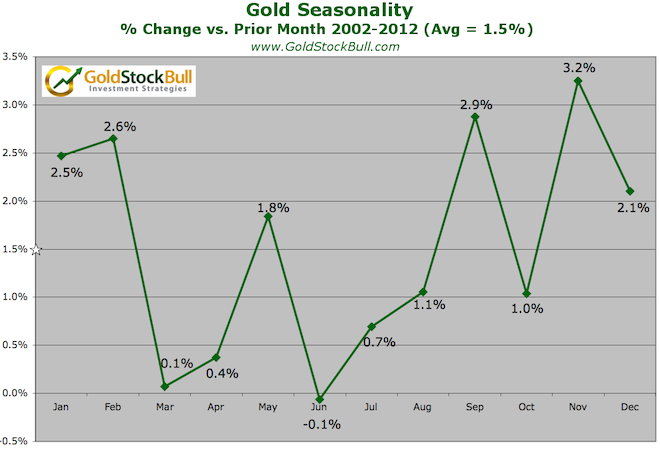
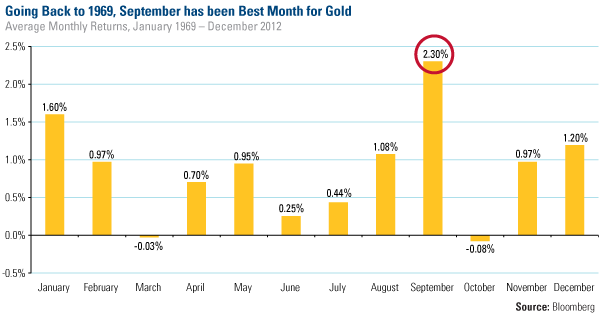
Lastly, let’s look at Gold seasonality. As you can see in the two charts below, Gold tends to perform well during the last 4 months of the year (as well as January). But September wasn’t so kind to Gold bulls. So will November or December be? That’s a great question. In the charts below, it does look like Gold tends to do well in November.
The chart below comes courtesy of GoldStockBull.com, and it shows that since 2002, Gold has fared very well in November.
Gold Seasonality – Percent Change vs Prior Month (2002-2012)
The next seasonal chart comes courtesy of Bloomberg. The data is through 2012, but it goes all the way back to 1969. It shows that September is the best month for Gold, with November thru February also performing well. The obvious question is why Gold underperformed in September this year?
Considering that September didn’t boost the yellow metal, I’m a bit skeptical here. But until the rally ends, investors won’t know for sure. Should seasonal trends work for Gold and push the metal back above $1220, and preferably $1250, then the Gold rally would have potential into January. That’s the near-term… intermediate-term (2015), Gold still has some headwinds to deal with (stronger Dollar, deflation, sluggish global growth, etc.).
Thanks for reading.
Follow Andrew on Twitter: @andrewnyquist
No position in any of the mentioned securities at the time of publication. Any opinions expressed herein are solely those of the author, and do not in any way represent the views or opinions of any other person or entity.


