The financial markets have seen an uptick in volatility with stocks gyrating back and forth in September. The government is debating 4 trillion dollars in infrastructure and social safety net spending bills, the debt ceiling is fast approaching, and the geopolitical scene is fractured.
Oh and COVID-19 and the delta variant are still active and in the middle of political debate across the country. And the price of gold is doing nothing.
Perhaps that’s being friendly. Gold has really struggled of late and this is pretty confounding. Maybe investors have confidence that all the uncertainties simply go away. Or perhaps equities have become as much a safe haven as gold, bonds, and defensives.
At any rate, we take a look at “daily” and “weekly” price charts of gold today, highlighting why gold bulls need to step up to the plate relatively soon… or perhaps we will extend this slide into a bigger dipper.
Note that the following MarketSmith charts are built with Investors Business Daily’s product suite.
I am an Investors Business Daily (IBD) partner and promote the use of their products. The entire platform offers a good mix of analysts, education, and technical and fundamental data.
$GLD SPDR Gold ETF Daily Chart
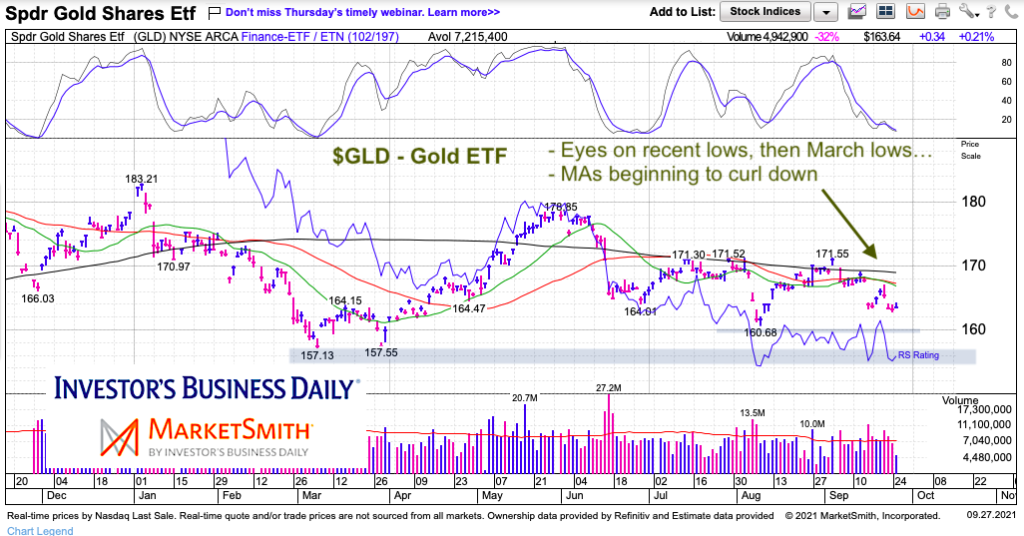
A couple weeks ago, I highlighted the importance of resistance at $171-$172 on Twitter. Well that resistance held and sent gold lower once more. What is concerning is the the 20/50/200 day moving averages are beginning to turn down. Gold is also nearing two key price supports at $160 and $157. Bulls need to step up soon.

$GLD SPDR Gold ETF Weekly Chart
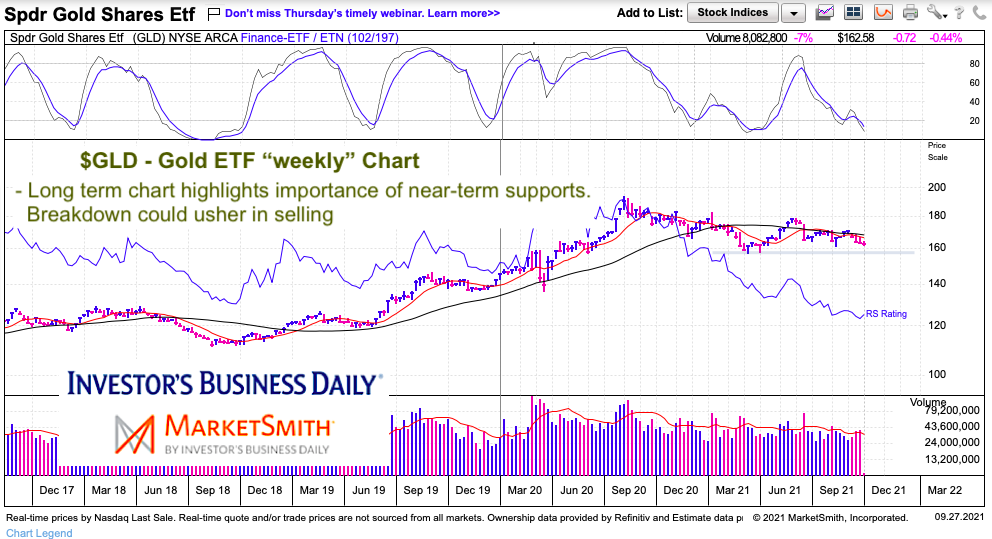
A step back highlights the importance of holding the $157 area on a weekly closing. A confirmed breakdown would likely usher in more selling and volatility.

Twitter: @andrewnyquist
The author may have a position in mentioned securities at the time of publication. Any opinions expressed herein are solely those of the author, and do not in any way represent the views or opinions of any other person or entity.


