The August Jobs report released earlier today seemed likely to move both commodities and equities. But after the report came in at an unspectacular (but not doomsday) addition of 173,000 jobs, it was only equities that were shaken up.
By mid-day, the S&P 500 was trading down around -1.7 percent. Meanwhile, Crude Oil and Gold prices were trading down by just -0.5 percent and -0.3 percent.
What’s interesting here is Gold. Or rather investors disinterest in the yellow metal… We’ve gone through several crises and a recent steep drop in stocks and Gold is still trading at just over $1100/oz? Many folks will now turn to the Federal Reserve meeting later this month and the debate surrounding a potential Fed rate hike. Let’s look at a couple charts.
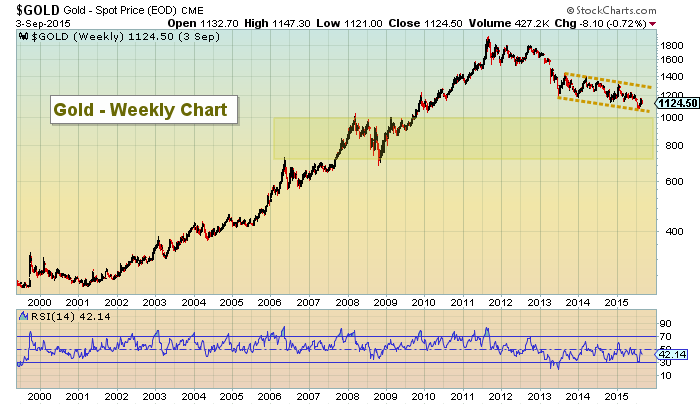
Here’s a 15 year chart of Gold prices. We can see that after the bull market run higher, there was a steep drop into 2013, followed by a steady descending “channel” thereafter.
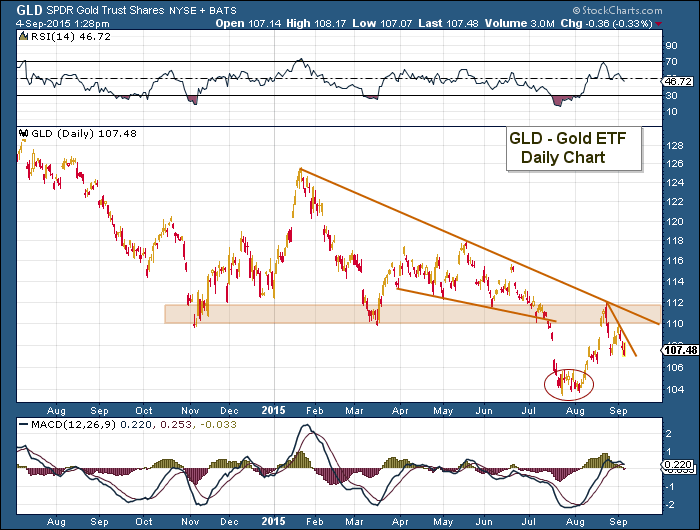
Next up is a shorter-term look at gold prices via the Gold ETF (GLD). As you can see, Gold broke down hard in what looked to be a near-term mini-capitulation. But the ensuing rally has been sold. Now Gold is at a crossroads. A rally through 108.50 should bring a retest of the descending trend line (currently around 111.50 and falling).
Gold bulls really need to see a break through above the August highs (clearing the $110-$112 resistance band (and descending trend line).
With market volatility ticking higher, it will be interesting to see what the September Fed meeting brings. As I always say, watch the price action. Fundamentals play a role for sure, but they show up in the ultimate market arbiter: “price”.
Thanks for reading.
Twitter: @andrewnyquist
The author does not have a position in any of the mentioned securities at the time of publication. Any opinions expressed herein are solely those of the author, and do not in any way represent the views or opinions of any other person or entity.


