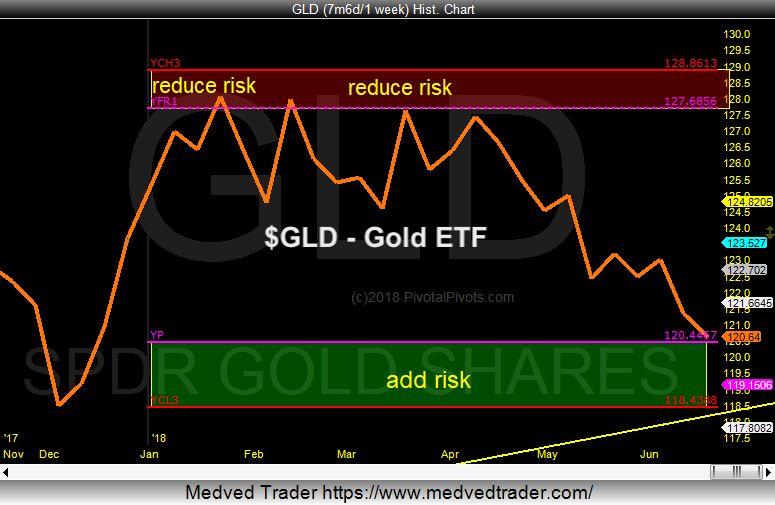
After struggling at the yearly resistance pivot (R1) earlier this year, Gold turned lower.
The price of Gold has since had a rough go of it. But Gold looks due for a bounce…
Why?
(GLD) is nearing important price support at its yearly pivot points in the range of $118 -$120.
The high earlier this year was registered at the yearly resistance (R1) pivot point. The subsequent move lower in the price of the Gold ETF (GLD) has created a pivot price pattern.
Usually, if price fails at the yearly R1 resistance pivot point, it declines to the YP yearly pivot point roughly 80 percent of the time. So these ten to be predictable price targets.
That said, I am now looking for a tradable bottom soon for Gold and its ETF $GLD.
Gold ETF (GLD) Chart with Yearly Pivot Points
To learn more about yearly pivot points, please check out my “Using multiple pivot points for trading opportunities” webinar.
Twitter: @Pivotal_Pivots
The author may have a position in mentioned securities at the time of publication. Any opinions expressed herein are solely those of the author, and do not in any way represent the views or opinions of any other person or entity.


