When the stock market is bullish and in cruise control, we usually see riskier assets performing well. As we often hear, “the market is in risk-on mode.”
The same applies to gold. When the price of gold is trending higher over, we often see Silver out-performing… or at least performing with a similar trend and price pattern.
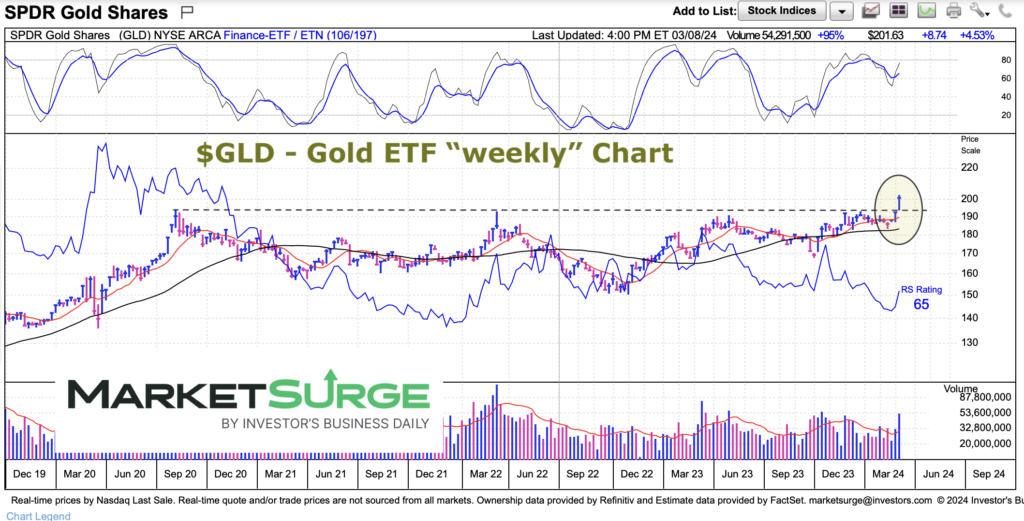
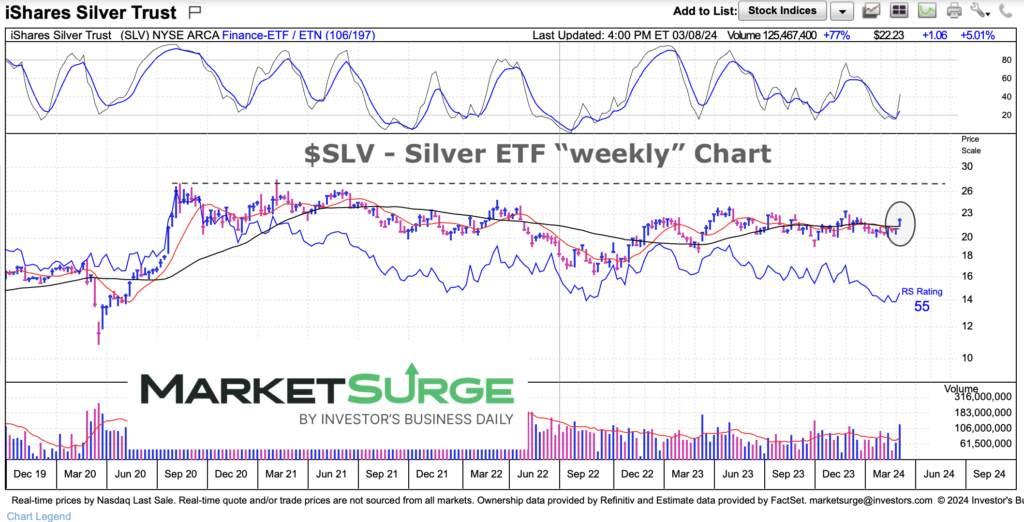
Gold broke out last week. Just how good was the gold price breakout? Well it surged through resistance to all-time highs, rising nearly 5 percent. Silver also performed well, but it is far from breaking out.
Today we simply highlight the two “weekly” charts and the importance that Silver plays catch-up and eventually breaks out. That would add strength to the gold price breakout.
Note that the following MarketSurge charts are built with Investors Business Daily’s product suite.
I am an Investors Business Daily (IBD) partner and promote the use of their products. The entire platform offers a good mix of tools, education, and technical and fundamental data.
$GLD Gold ETF “weekly” Chart
Gold is breaking out to new highs. The past two weekly candles have been very strong.
This bodes will longer-term. New highs are always bullish. But as we stated previously, Silver is lagging. If this rally is going to continue into a longer-term trend, Gold bulls want Silver begin out-performing. See the next chart.

$SLV Silver ETF “weekly” Chart
Excellent weekly performance for Silver… yet it is far from breaking out to new highs.

Twitter: @andrewnyquist
The author may have a position in mentioned securities at the time of publication. Any opinions expressed herein are solely those of the author, and do not in any way represent the views or opinions of any other person or entity.


